

If I was going to study just two things to research ANZ Banking Group (ASX: ANZ) shares or Bank of Queensland Ltd (ASX: BOQ) shares today, below I’ve listed two of the first things I’d look at… (below the share price commentary).
ANZ share price & BOQ share price
As you can see below, the ANZ share price and BOQ share price have raced ahead of the S&P/ASX 200 (ASX: XJO) index.
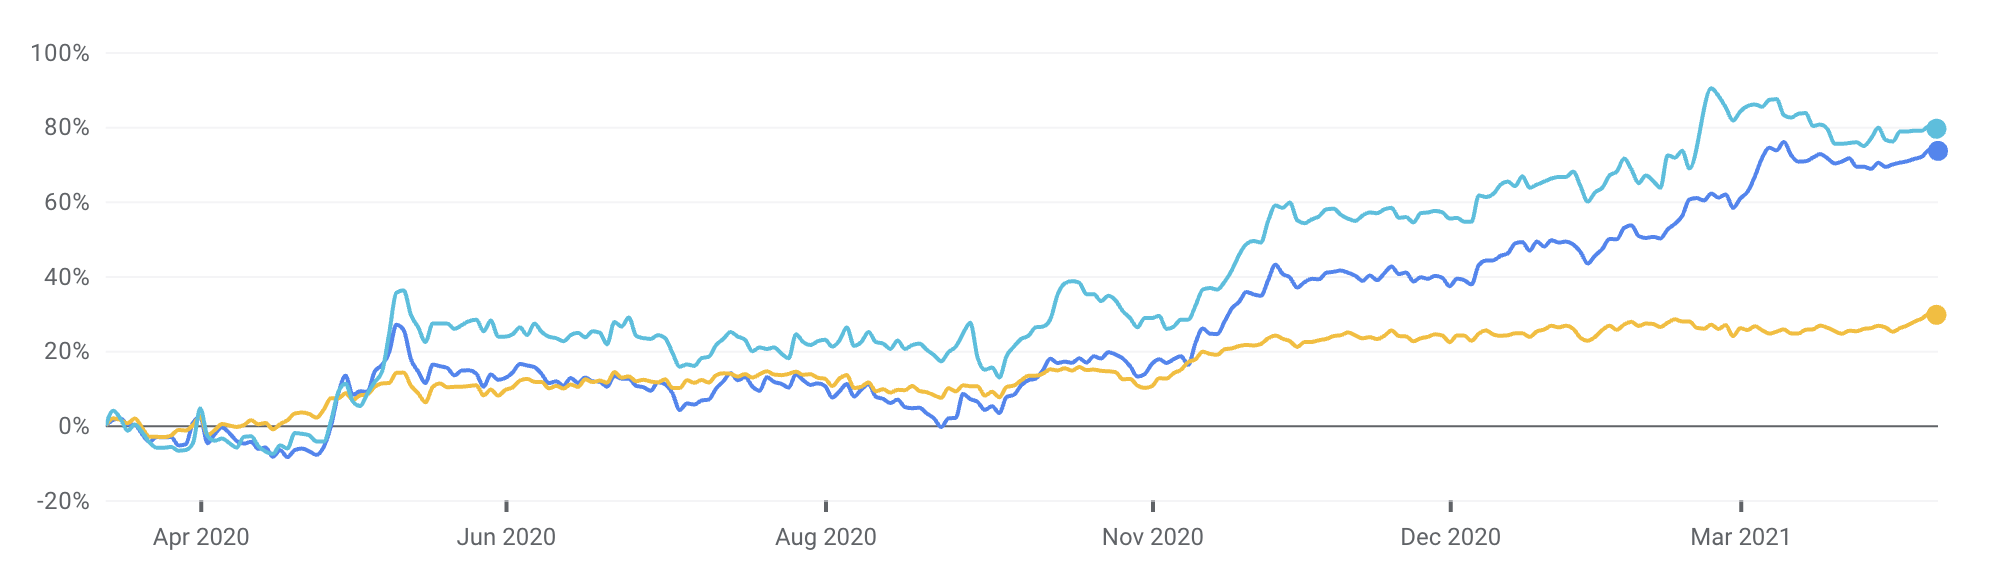
As you can see in the chart above, the ANZ share price has jumped 73% higher over the past 12 months while the BOQ share price is up an impressive 79%. That compares to the ASX 200 price return of 29%.
Side note: none of these share prices includes the positive impact of dividends paid. If you ever want to study the returns of the ASX 200 with dividends you can use this page of Rask Media to study the ASX 200 Total Return index (INDEXASX: XNT). Here’s how the ASX 200 total return has fared over the past year:
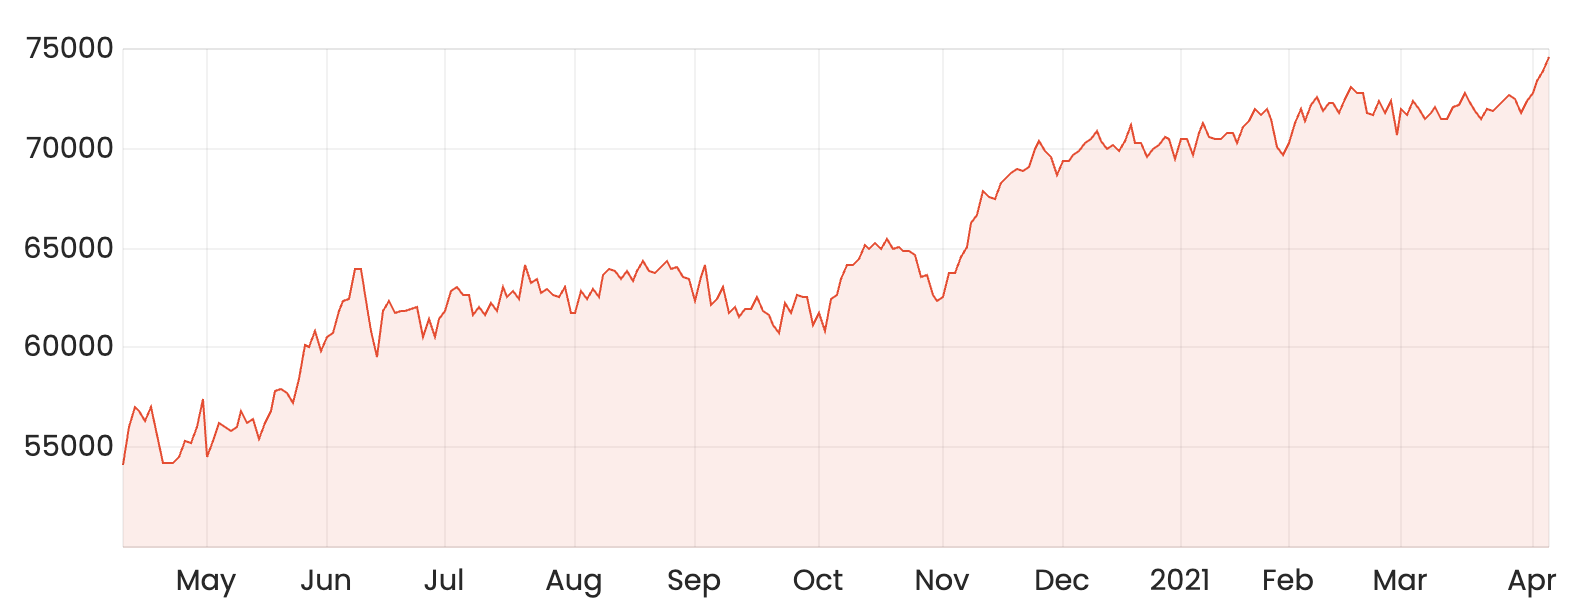
The ASX 200 Total Return (XNT) is up ~33% in the past 12 months versus the ASX 200 (no dividends, XJO) which is up 29%.
2 ways to study ANZ shares
The two ways I’d begin to study BOQ and ANZ shares are as follows:
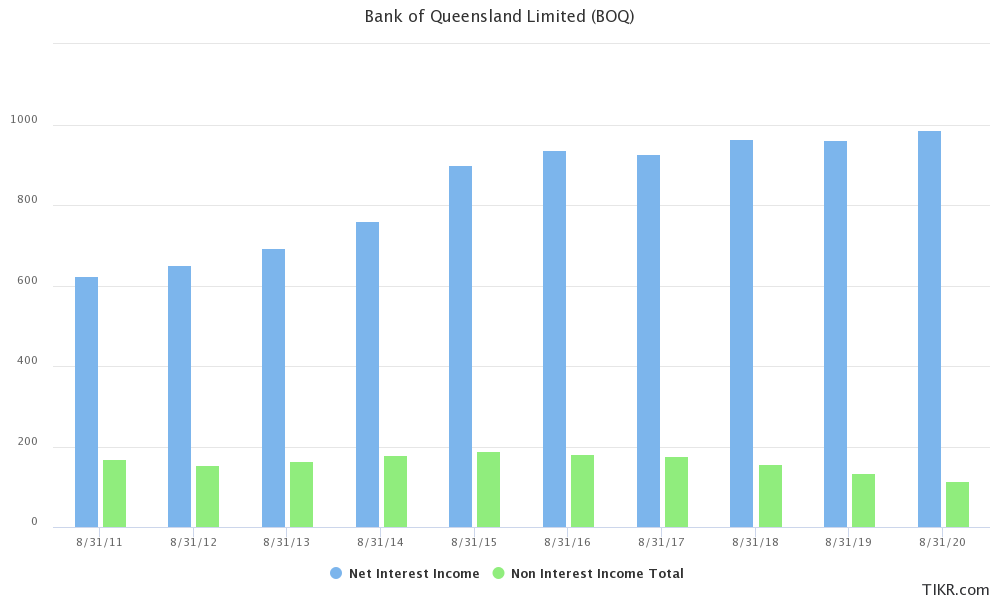
1. Understand how they make money.
You can do this by studying the difference between net interest income (money from lending) versus non-interest income (other income from things like insurance, fees, etc — called non-interest income). Both banks earn the majority of their money from lending.
2. Know how profitable they are.
You can study bank profitability by looking at the net interest margin, see my CBA share price analysis
example here.
You can also analyse bad debts as a percentage of total loans, which tells you how good the bank is at lending over a cycle. You could also study the operating costs as a per cent of income, which tells you how operationally effective the bank is (e.g. after staff, marketing, and other admin costs).
Finally, you could study the Return on Equity, which compares bank profit to its shareholder equity. Keep in mind this isn’t a perfect metric and because banks use lots of debt to finance their lending, the ROE metric doesn’t capture all capital sources.
Nonetheless, below is what the ROE looks like for ANZ and BOQ over time.
As a Big Four bank with a larger market share, better funding sources and diversification, ANZ tends to achieve a better ROE.
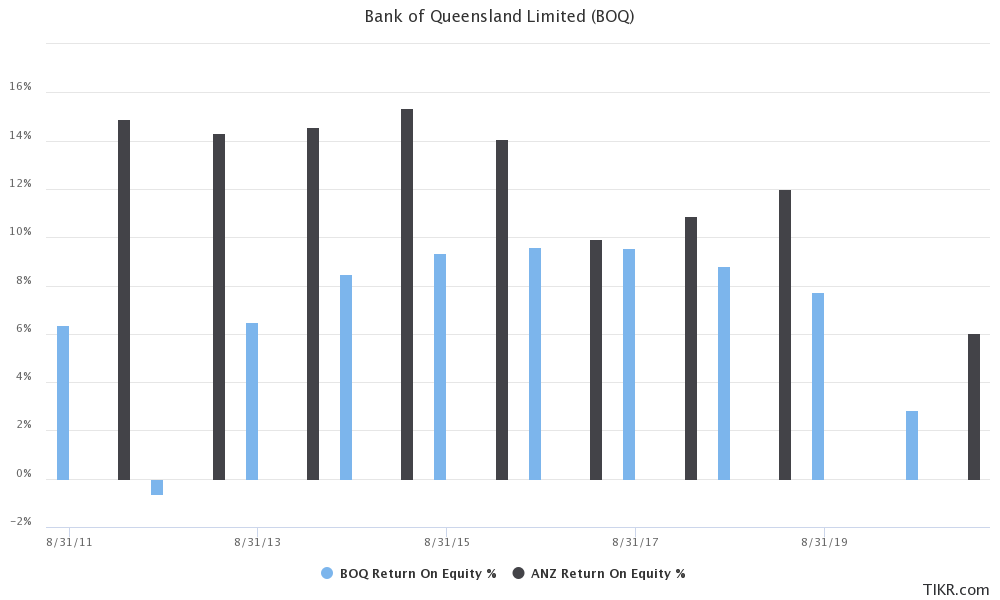
Source: Tikr
Summary
These two metrics or tools, knowing what the bank does and its profitability, are only the very start of an investing process. Take your time, and care, to ensure you’re really considered before buying any bank shares because they are not always easy companies to research. If you’re looking for other dividend share ideas, maybe add Argo Investments (ASX: ARG) or Australian Foundation Investment Company (ASX: AFI) to your list. Or even a dividend ETF.


