
The Commonwealth Bank of Australia (ASX: CBA) or just CBA share price is currently sitting at $86.82. So… that’s the CBA share price but what are they actually worth?
That’s a harder — but more important — metric you need to calculate.
Don’t know how to put a valuation on CBA shares? In this short article, I’ll share two quick tricks to do a CBA share price valuation. Plus some of my video tutorials that you can adapt to value any S&P/ASX 200 (INDEXASX: XJO) company.
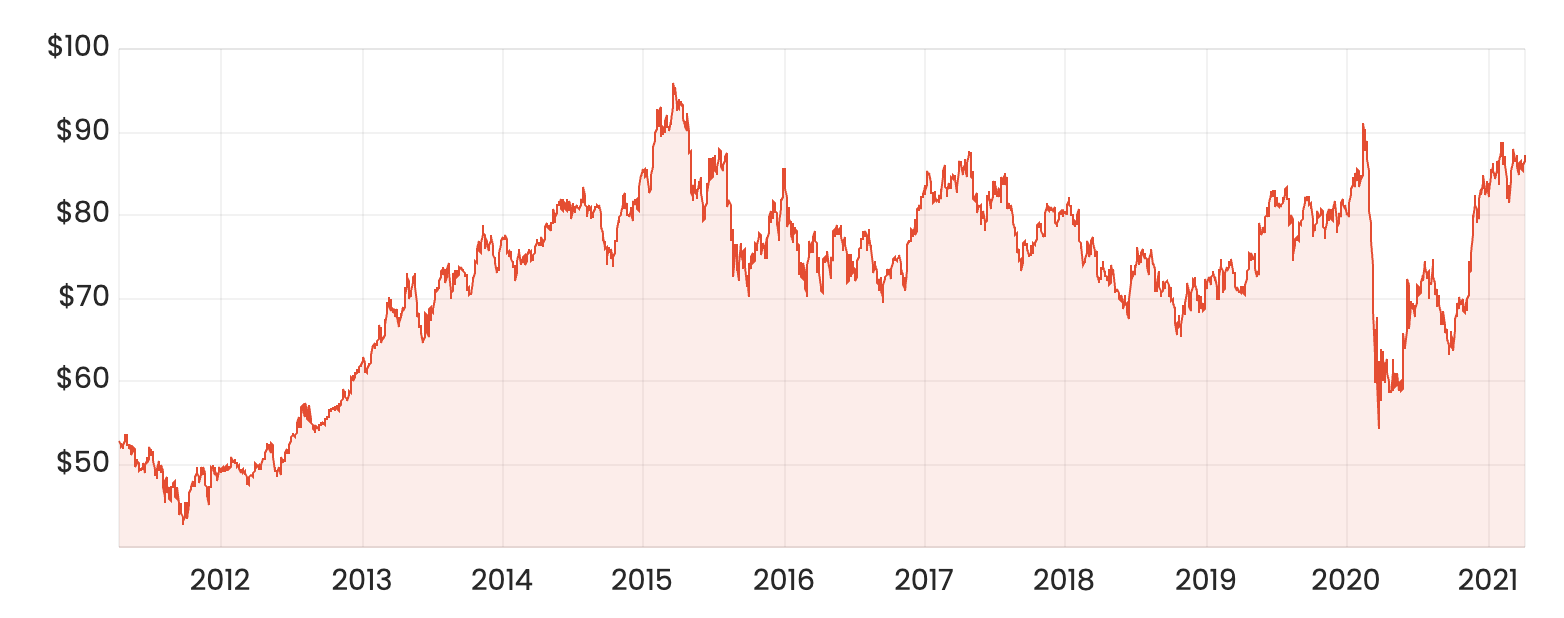
CBA share price chart – 10 years
Quick ASX bank share valuation hacks
The following explainers are really just examples. I reckon you should enrol in our free share valuation course, which uses Woolworths Ltd (ASX: WOW) as my case study, to get a better understanding the most popular share valuation techniques like ratio analysis, EPV, dividend models and discounted cash flow (DCF).
Here are the two valuation techniques to use on CBA shares.
CBA price-earnings ratio valuation
The price-earnings ratio or ‘PER’ compares a company’s share price (P) to its most recent full-year earnings per share (E). It’s by far the most common ratio to use in valuation — but it’s probably the least useful for me.
Remember, ‘earnings’ is just another word for profit. Hence, the ‘P/E’ ratio is simply comparing share price to the most recent full-year profit of the company. Some experts will try to tell you that ‘the lower PE ratio is better’ because it means the share price is ‘low’ relative to the profits produced by the company. However, sometimes shares are cheap for a reason!
Using CBA’s share price today, together with the earnings per share data from its 2020 financial year, we can calculate the company’s PE ratio to be 23.6x. That compares to the banking sector average PE of 24x.
Reversing the logic here, we can take the profits per share (EPS) ($3.68) and multiply it by the ‘mean average’ valuation for CBA. This results in a ‘sector-adjusted’ share valuation of around $90.06.
CBA dividend valuation (quick version)
A dividend discount model or DDM is one of the easier and more efficient ways to value bank shares. For an industrial company, ASX growth shares or tech company I’d use a DCF analysis. However, a DCF analysis needs free cash flow
(FCF), but that doesn’t work for a bank. So instead I use dividend payments as the ‘cash flow to equity holder’.
To do a DDM we have to estimate the bank’s dividends going forward (i.e. the next full-year dividend) and then apply a risk rating. Using a simple DDM, let’s assume the bank’s dividend payment grows at a consistent yearly rate into the future somewhere between 2% and 3%. For the risk rating, we will use a blended risk rate by taking the average valuations produced when I used risk rates between 6% and 11%.
For a more detailed explainer of dividend valuations, you can watch my free dividend valuation tutorial or enrol in my free share valuation course (you can get a sneakpeak in this video):
So what’s the result for CBA’s dividends?
Our simple DDM valuation of CBA shares is $39.09. However, using an ‘adjusted’ dividend payment of $3.37 per share, which removes some of the impact of COVID, the valuation goes to $53.11. The valuation compares to CBA’s current share price of $86.95. Keep in mind I haven’t included the positive impact of franking credits — which boost the valuation.
What this means is, although the shares might seem expensive using our simple DDM model, don’t make a decision based on this article. Please go away now and consider all of the risks and ideas we presented here. While you’re at it, you might also consider a diversified shares ETF, dividend fund or at least grab a copy of my free investment report below.
I also recently wrote a similar article on National Austalia Bank Ltd (ASX: NAB), asking Are NAB Shares Worth $20? For more ideas, my Rask Media colleague Jaz Harrison wrote today “ASX dividend shares I’d buy for my grandparents“.


