

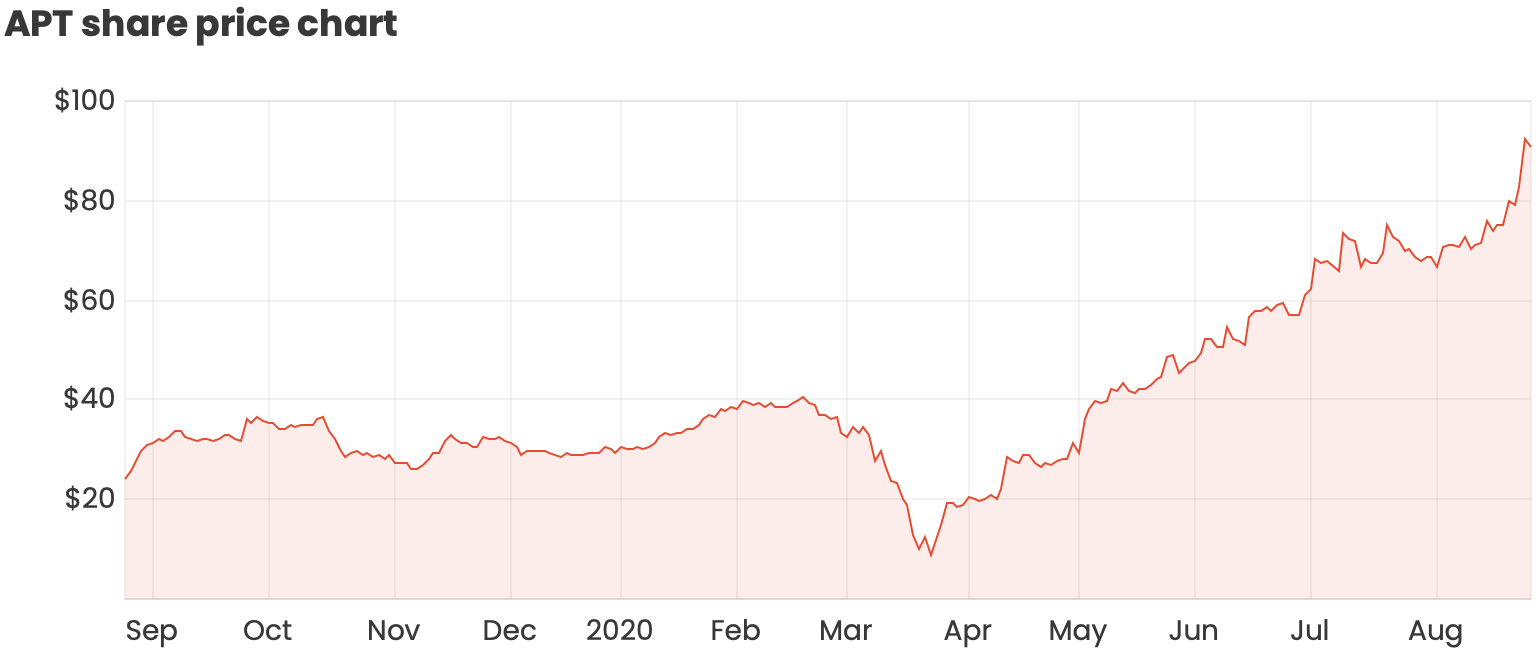
The Afterpay Ltd (ASX: APT) share price is marching towards the $100 mark today after the buy now, pay later (BNPL) market darling released its hotly-anticipated full-year results. In early morning trade, Afterpay shares have jumped more than 5%.
Afterpay’s journey on the ASX this year has been well-documented, falling under $10 in the March bear market before slingshotting higher on the back of government stimulus, the surge in online shopping and a whole lot of market optimism.
Before we dig into today’s results, here’s a recap of Afterpay’s recent announcements:
- Expansion into Europe
- FY20 update
- Capital raising, co-founder sell down and trading update
- US update
Unpacking Afterpay’s FY20 report
For the full-year, Afterpay reported income of $502.7 million, up 103% from $247 million in FY19. Including late fees and revenue from the PayNow business, total income came in at $519.2 million, up 97%.
EBITDA increased by 73% to $44.4 million, excluding significant items such as foreign currency gains, share-based payment expenses and one-off items. EBITDA in the more mature Australian and New Zealand (ANZ) market grew 62% to $142.2 million (excluding significant items), demonstrating a path to profitability that can be replicated in new international markets.
On the bottom line, Afterpay reported a statutory loss after tax of $22.9 million, an improvement on the $43.8 million loss recorded in FY19. The company’s operating loss also improved, coming in at -$4.6 million compared to -$31.7 million in the prior year.
Including proceeds from its July capital raising, Afterpay had pro forma cash of $1.38 billion and pro forma liquidity and growth capacity of $2.04 billion.
At the end of the year, there were $782 million of receivables sitting on Afterpay’s balance sheet after factoring in $34 million of expected credit losses. This provision for expected credit losses represents around 4.1% of total receivables.
Margins & credit losses
Followers of Afterpay will know the importance of Afterpay’s net transaction margin (NTM) and net transaction loss (NTL).
Afterpay calculates NTL by subtracting total late fees from the gross loss (bad debts plus collection costs) for the period. Meanwhile, NTM is the net margin after losses and variable transaction costs have been taken into account.
- NTL = Gross Loss – Late Fees
- NTM = Afterpay Income – NTL – Other Variable Transaction Costs
Put simply, NTL represents Afterpay’s credit risk (i.e. customers failing to repay their outstanding balance), while NTM is effectively an operating profit margin.
NTL for the year was $42.8 million, representing 0.38% of underlying sales – a slight improvement from 0.42% in the prior year. Late fees grew at a slower rate than the increase in underlying sales, coming in at $68.8 million (13.7% of Afterpay total income or 0.6% of underlying sales). Gross loss also reduced as a percentage of underlying sales, coming in at a historic low of 0.9%.
Turning to margins, Afterpay reported NTM of $250 million, which translates to 2.25% of underlying sales – slightly lower than 2.27% in FY19. This was despite an increasing contribution from newer international markets which are initially lower-margin.
Merchant margins also edged higher in FY20, up 1 percentage point to 3.9% of underlying sales, supported by a growing number of small to medium-sized businesses joining the platform. Afterpay said average merchant margins are broadly consistent across all geographies.
Beyond the financials
Afterpay’s investor presentation was jam-packed with graphs and charts and new data points. Here are some of the highlights:
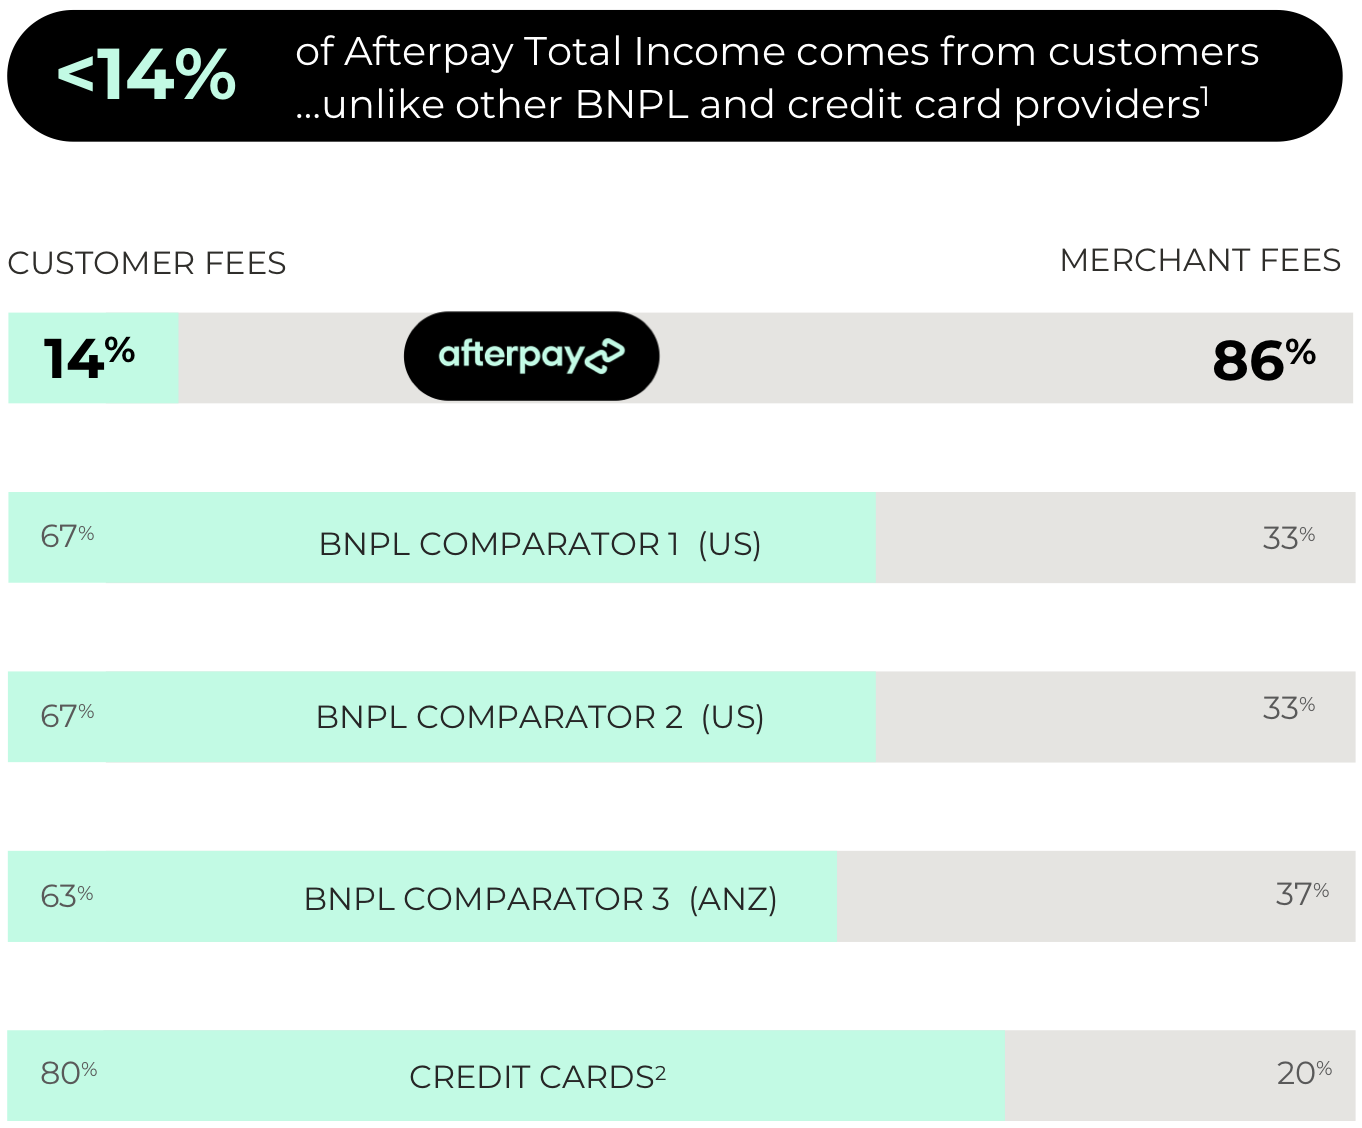
Afterpay makes money from merchants
Afterpay pointed out that it earns less than 14% of total income from customers (i.e. via late fees), unlike other BNPL and credit card providers.
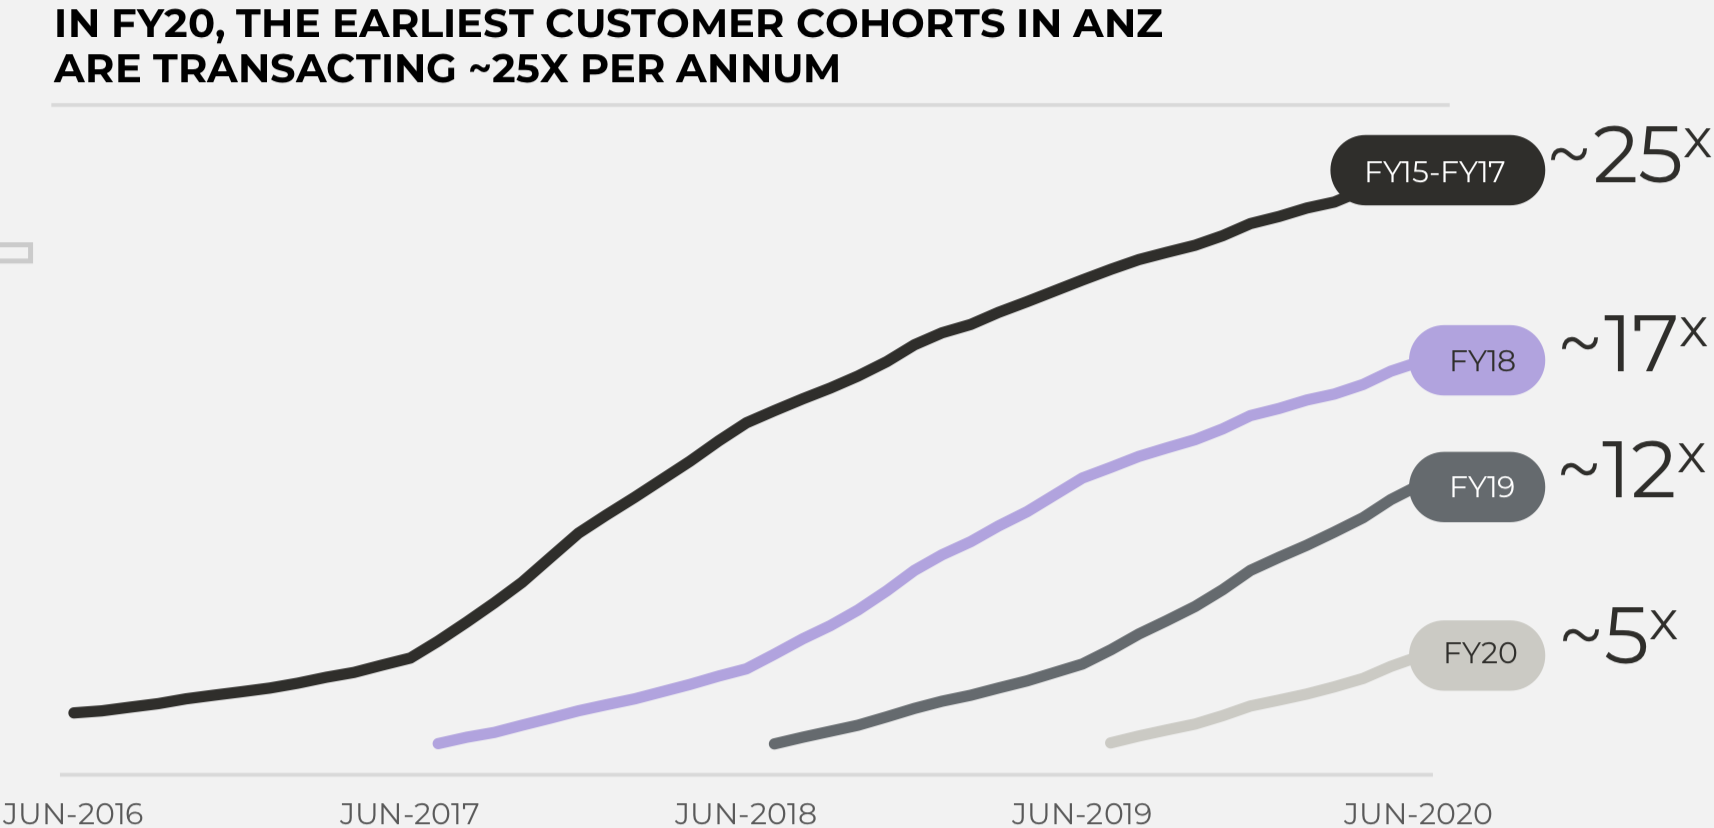
Afterpay customers become more valuable over time
Afterpay is seeing high average purchase frequency across its customer base, including ~25 times per annum for the earliest customer cohorts.
For example, the chart below says that customers who joined Afterpay between FY15 and FY17 are, on average, making around 25 transactions through Afterpay each year.
Strong network dynamics in the US
According to Afterpay, it has stronger US network dynamics than its peers, citing better customer retention rates and increasing cart values.
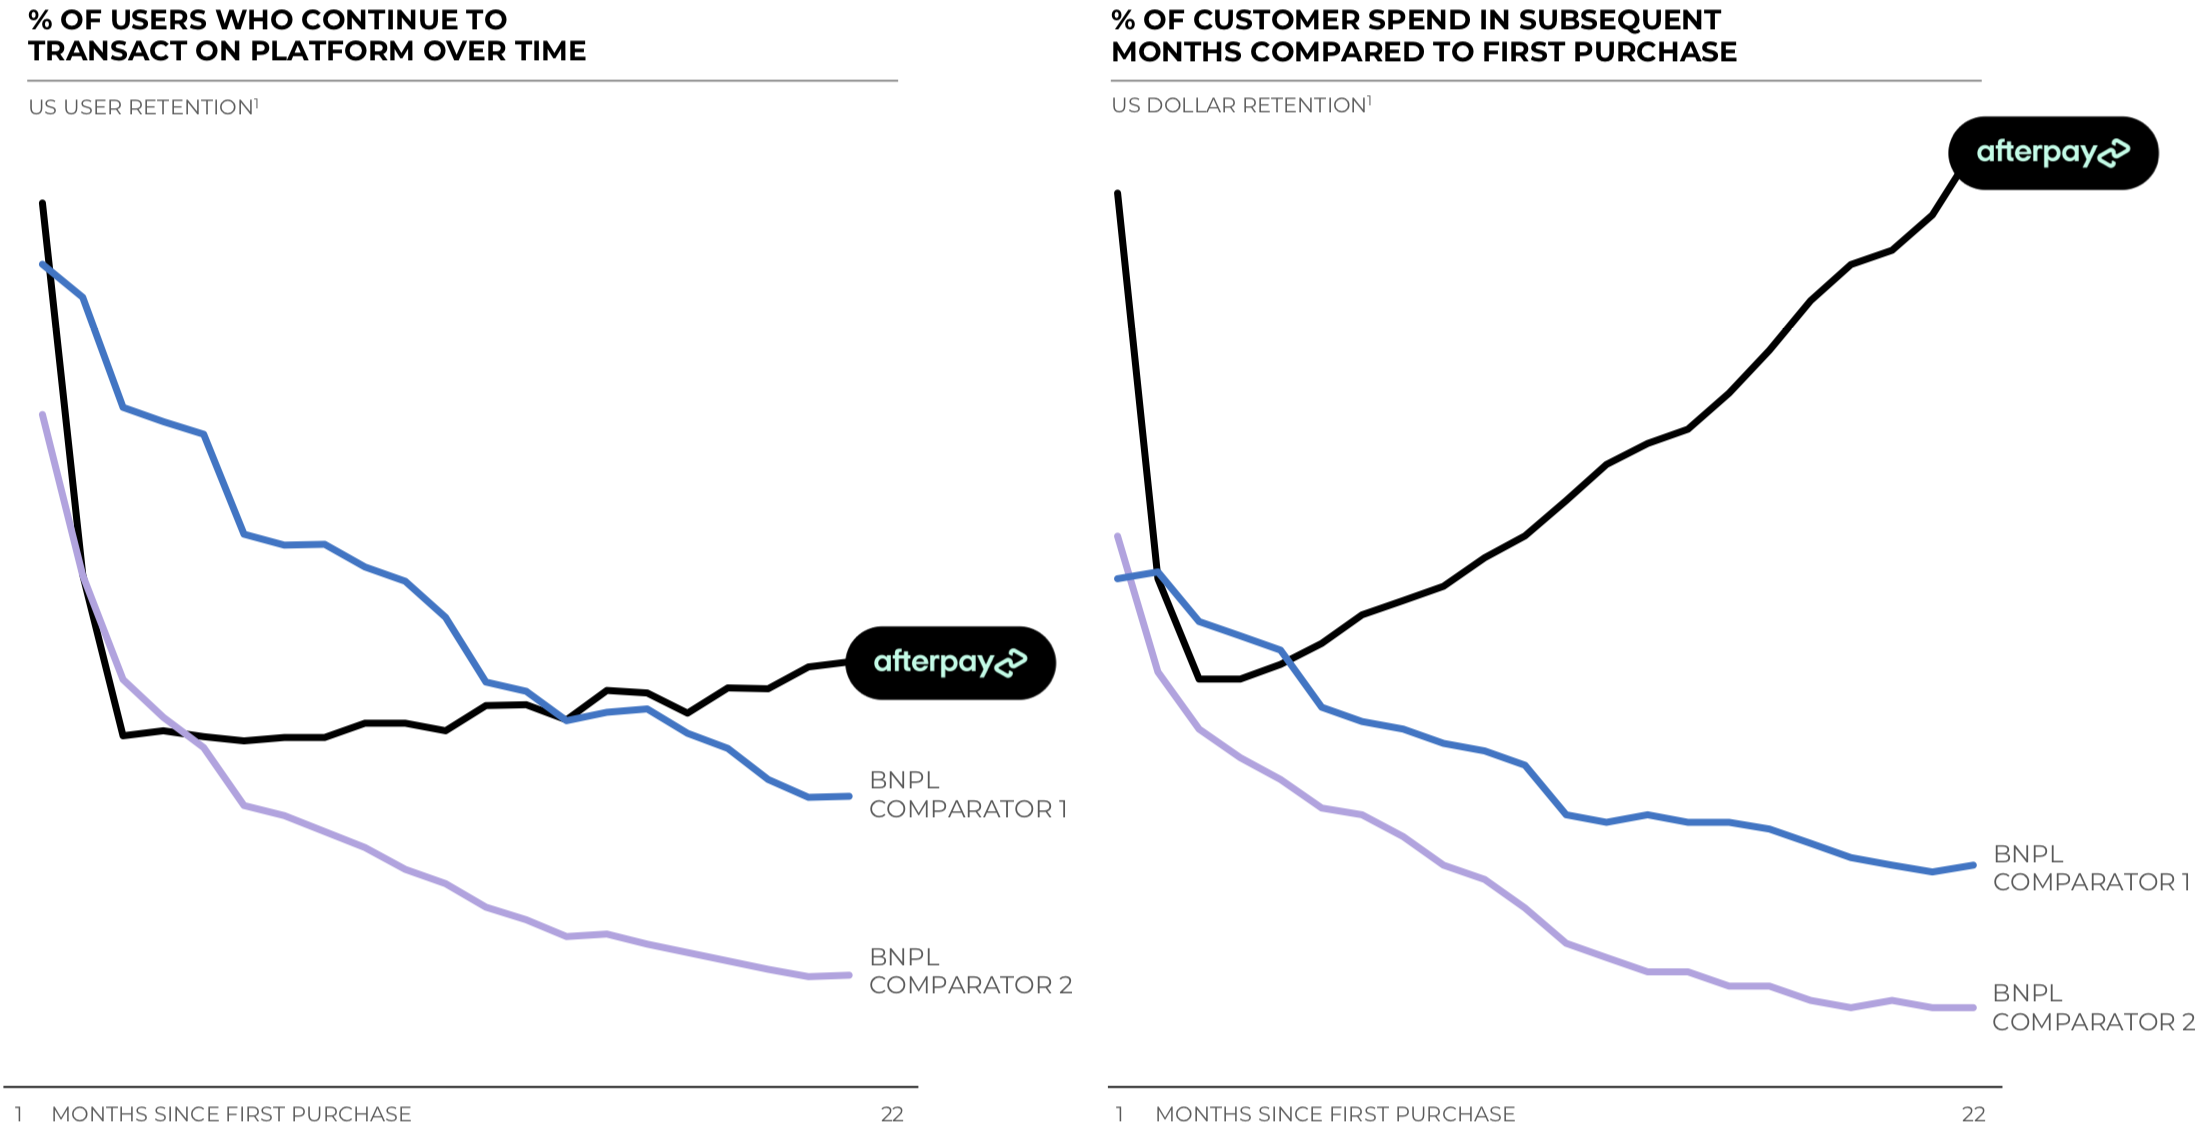
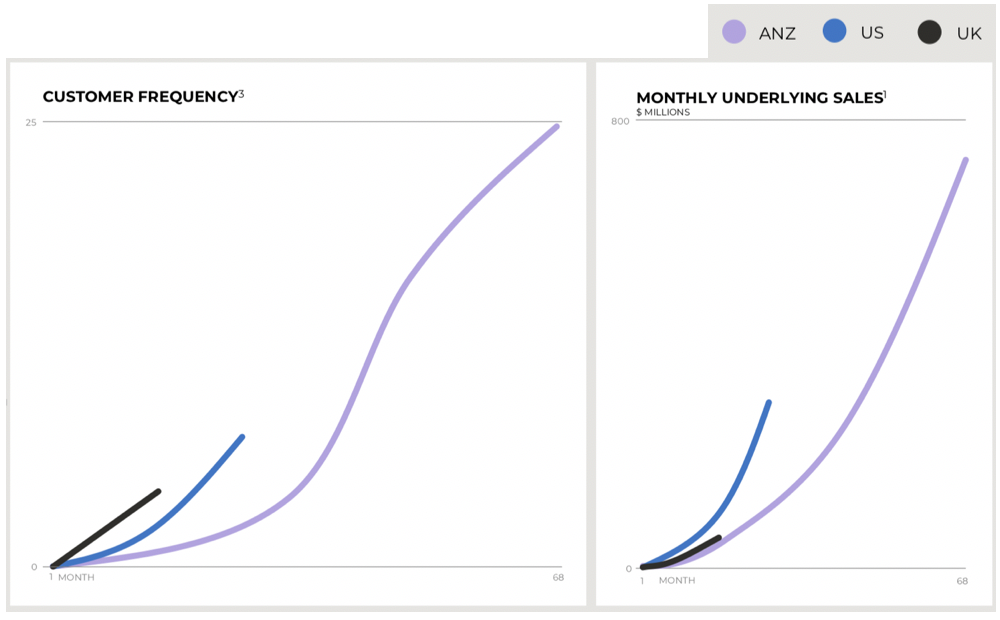
New markets replicating ANZ success
The left-hand-side chart below the shows that the newer US and UK markets are following a similar customer frequency trajectory to the blueprint established by the ANZ business. But as you can see in the chart on the right, the US is scaling at a faster rate.
Other interesting data points include:
- Customers are transacting more frequently the longer they remain on the platform, with ~90% of underlying monthly sales coming from repeat customers
- An average of 17,300 new customers were added to the Afterpay platform per day during FY20, which increased to 20,500 new customers per day in Q4
- The Afterpay platform generated an average of 14.5 million customer referrals to retail partners per month in Q4 – demonstrating Afterpay’s influence and reach, which it could monetise in time
FY21 performance update
Afterpay noted that its strong performance in Q4 FY20 has continued into FY21 across all regions.
Online sales in ANZ accelerated into July and August, and the recent onboarding of large scale, new vertical merchants like Chemist Warehouse is expected to deliver continued growth into FY21.
In the US, underlying sales in July continued at the record levels experienced in Q4 and customer acquisition remains strong.
Afterpay also said that merchant acceptance in the UK has continued strongly since 30 June, with 450 additional active merchants added to the platform.
New markets
Afterpay launched in Canada this month with retailers such as American Eagle, Dermalogica, and Herschel.
Following its recently-announced acquisition of Pagantis, Afterpay is working towards launching in Spain, France, Italy and Portugal as it looks to contend with Swedish fintech giant Klarna in the European market. It’s worth noting that despite holding leading positions in the Nordic and DACH regions, Klarna isn’t as established in southern Europe.
Additionally, Afterpay revealed that an in-region team will be established in Asia through a small acquisition of Singapore-based company EmpatKali, which currently operates in Indonesia. Afterpay also said it is exploring opportunities to leverage the network of strategic investor Tencent to expand into new regions in Asia.
Summary
Overall, I thought this was a solid set of results from the ASX BNPL leader. Maintaining NTL and NTM with the prior year is an impressive feat and the US business is finally starting to hit scale.
With new international markets, a recently-launched loyalty program and embedded optionality through things like data analytics, Afterpay certainly has a tremendous runway for growth.
That being said, I’m not sure Afterpay’s current lofty share price is justified. BNPL shares have been going through a purple patch and the million-dollar question is whether or not prices have run too far.
When you combine this with COVID-19 uncertainty and the impact of JobKeeper payments on consumer behaviour, I’m personally not in a hurry to add to my Afterpay shareholding today.