

Last week, we heard from ASX gold miners Northern Star Resources Ltd (ASX: NST) and Saracen Mineral Holdings Limited (ASX: SAR) when the pair reported their full-year FY20 results.
Today it was St Barbara Ltd (ASX: SBM)’s turn to report, revealing revenue growth on the back of contributions from the recently acquired Atlantic Gold, but lower profits.
St Barbara share price – 12 months
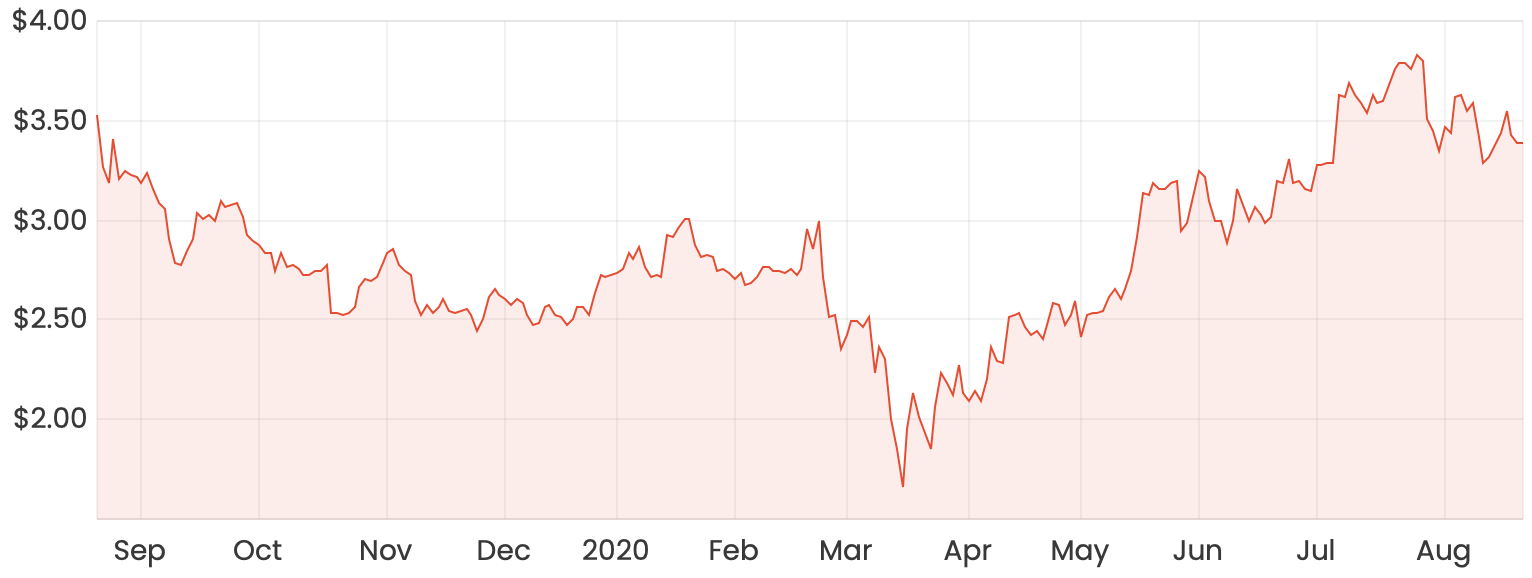
As you can see in the chart above, the St Barbara share price is trading relatively flat over the year-ago period but has climbed significantly in recent months on the back of the rallying gold price.
St Barbara is an Australian-based gold producer and explorer. Its current assets include the Leonora operations in Western Australia, Simberi operations in Papua New Guinea, and Atlantic Gold operations in Nova Scotia, Canada.
St Barbara’s FY20 report
In FY20, St Barbara produced 381,887 ounces of gold, up 5.3% over FY19, while gold sales amounted to 381,105 ounces at an average gold price of $2,123 per ounce – up from an average price of $1,762 per ounce in FY19.
The higher production was attributed to the recently acquired Atlantic Gold, with 106,663 ounces of gold production and 107,076 ounces of gold sales from the date of acquisition in July 2019. However, this was partially offset by lower production at Leonora and Simberi.
St Barbara’s consolidated all-in sustaining cost (AISC) increased 27% to $1,369 per ounce in FY20, reflecting the impact of lower production and higher operating costs at Gwalia and Simberi, together with an increase in sustaining capital expenditure at Gwalia.
For the full-year, St Barbara reported revenue and other income of $830 million, up 26% compared to FY19, leading to a 23% increase in EBITDA which came in at $339 million.
Lower production from the company’s Leonora and Simberi operations led to a drop in revenue, down 9.4% and 7.3% respectively. However, the higher gold price and contribution from Atlantic Gold operations ensured total revenue improved over the prior year.
EBITDA from Leonora and Simberi also declined in FY20, down 21.4% and 24.4% respectively. But again, a $160 million EBITDA contribution from Atlantic Gold led to an overall increase in FY20, up 23% over FY19 to $339 million – this despite a 1 percentage point decrease in EBITDA margin to 41%.
However, this $339 million EBITDA figure excludes significant items, including the costs associated with the Atlantic Gold acquisition, mark-to-market movements in gold derivatives and the benefit of a reduction in tax rate in Nova Scotia.
On the bottom line, a significant step-up in depreciation and amortisation expenses led to an 11% decrease in net profit after tax to $128 million.
At the end of the financial year, St Barbara had $406 million in cash and cash deposits, and $307 million debt. The company drew down $200 million from an existing syndicated facility in March 2020, however, with operations maintaining production, St Barbara decided to repay the $200 million in July.
St Barbara dividend
St Barbara declared a final dividend of 4 cents per share, bringing full-year dividends to 8 cents per share in FY20.
This is consistent with FY19 dividends and translates to a dividend yield of 2.3% based on St Barbara’s closing price of $3.41.
What happens next?
In its annual report, St Barbara said its focus is on maximising production at the lowest possible cost from Gwalia, Simberi and Atlantic Gold, and to extend mine life through drilling and capital development.
Focused exploration and business development activity will continue within COVID-19 restrictions.
Regarding FY21 outlook, St Barbara is expecting gold production in the range of 370,000 to 410,000 ounces, while AISC is expected to be in the range of $1,360 to $1,510 per ounce. The mid-point of production guidance represents 2.3% growth over FY20, while the mid-point of AISC guidance is 4.8% higher than FY20.
Although St Barbara’s exploration activities were initially shut down due to COVID-19, fieldwork had largely resumed by the end of June following extensive consultation, planning and risk management prior to restarting.


