

Alphabet Inc’s (NASDAQ: GOOGL) Google owns online search and, with Facebook (NASDAQ: FB), co-owns the business of online advertising.
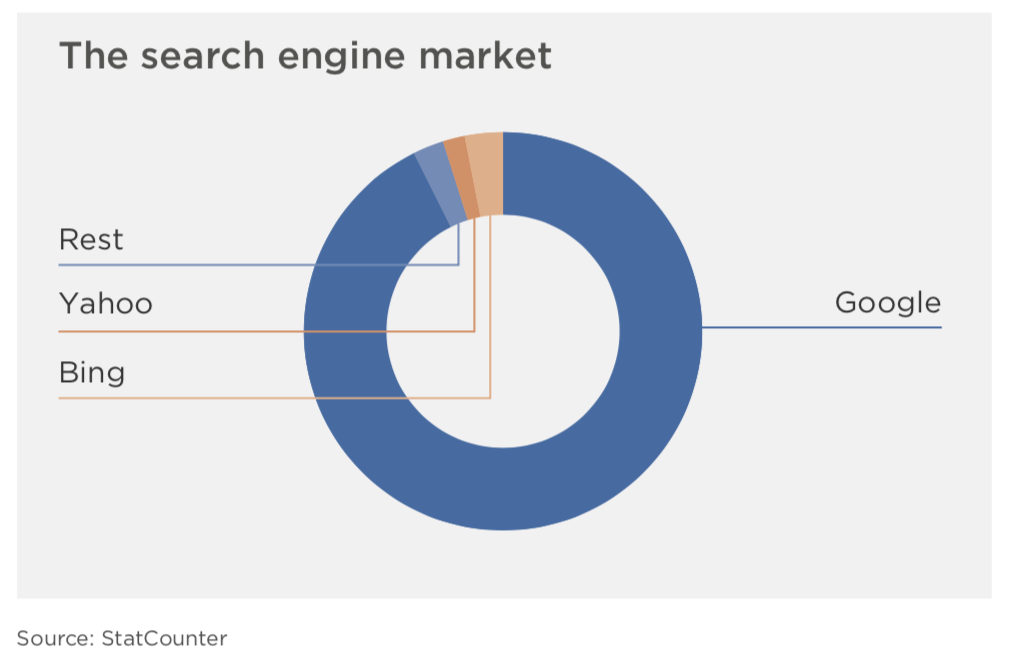
In the US, Google’s share of the search engine market was an extraordinary 90% in January of 2009; a decade later it was higher still at 93% — 34 times the size of its closest competitor. Globally, Google’s share today is a remarkable 90%. Here’s what total domination looks like:
Moving from search queries to search money, Google’s worldwide share of digital ad revenue was 32.4% in 2018, up slightly compared to 2011. The ‘digital duopoly’ of Google and Facebook together account for over half the market, up from 35.8% in 2011. In the US, their combined share is higher still at almost 60%.
In building its formidable position in search, Google has seen off competitive attacks from Yahoo (acquired by Verizon in 2017), AOL (also owned by Verizon), and Microsoft (Bing). It has swatted away multiple governmental investigations into its competitive behaviour in both Europe and the US, and successfully evolved its search business model from desktop to mobile. It has reinforced the value of its search algorithms by acquiring or building dominant positions in online maps, online video, web browsers and mobile operating systems, among many others services, all of which provide Google with more of the magic ingredient of targeting online advertising – user data.
The era Google has entered – Rising Heavyweight Competition
Google’s ‘bread and butter’ – online search and the digital advertising dollars that it produces – is under serious competitive pressure from fellow FAANGs member Amazon (NASDAQ: AMZN). According to eMarketer, Amazon will account for 8.8% of US online advertising this year, up from 6.8% last year, putting it in third position and more than twice the size of the #4 player.
If digital advertising is Google’s bread and butter, retail online advertising is the jam. According to Marketplace Pulse, the
the retail sector accounts for 38% of total US digital ad spending.
In retail perhaps more than any other category, there is a very valuable and increasingly direct relationship between search and advertising – search precedes purchase, and both search and purchase create data, which is the currency of targeted online advertising. Here Google is rapidly losing its advantage.
Half of all searches related to online shopping now start on Amazon compared to just 21.8% for Google (Toluna Research). In the US, 66% of all product searches – for both online and instore purchases – now begin on Amazon, more than three times the number that begin on Google (eMarketer.com). When consumers have a specific product in mind, Amazon is the destination of choice for 74% of product searches, more than seven times that of Google.
Data is the currency of online advertising, and data is underpinned by trust.
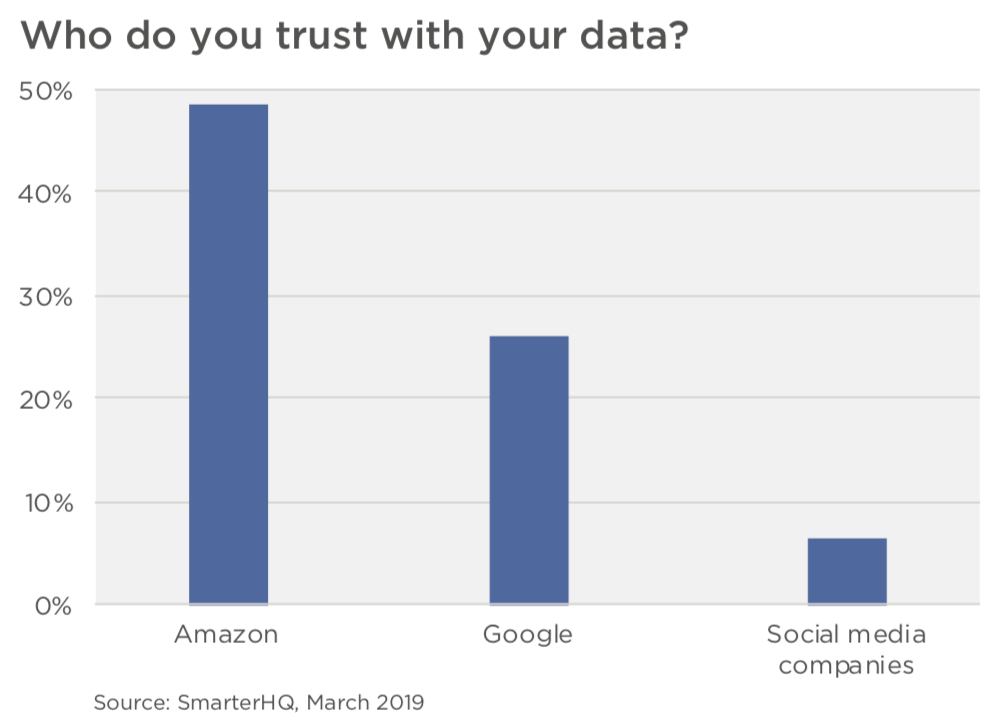
With its dominant position in ecommerce, Amazon has rich, valuable data related to purchasing behaviour. Because it captures 50% of retail spending online, for online retail advertisers Amazon can offer both better measurability than its two larger peers, and a higher return on advertising investment. Of frequent online shoppers in the US, 73% have clicked on an Amazon product ad while browsing; 83% of those then purchased the product and 60% said the ads were helpful (Feedvisor’s 2019 Amazon Consumer Behavior Report).
Perhaps taking a leaf out of Google’s book, Amazon is leveraging its muscle with online retailers on its platform by prioritising in its product listing those sellers who advertise on Amazon. Given that all of Amazon’s online advertising is from the retail sector, from its 8.8% share of total online advertising we can infer that it has a 23% share of the retail advertising category online. Amazon is now the #2 player and larger than Facebook in the world’s single largest online advertising category: US retail.
Maturing Core Market
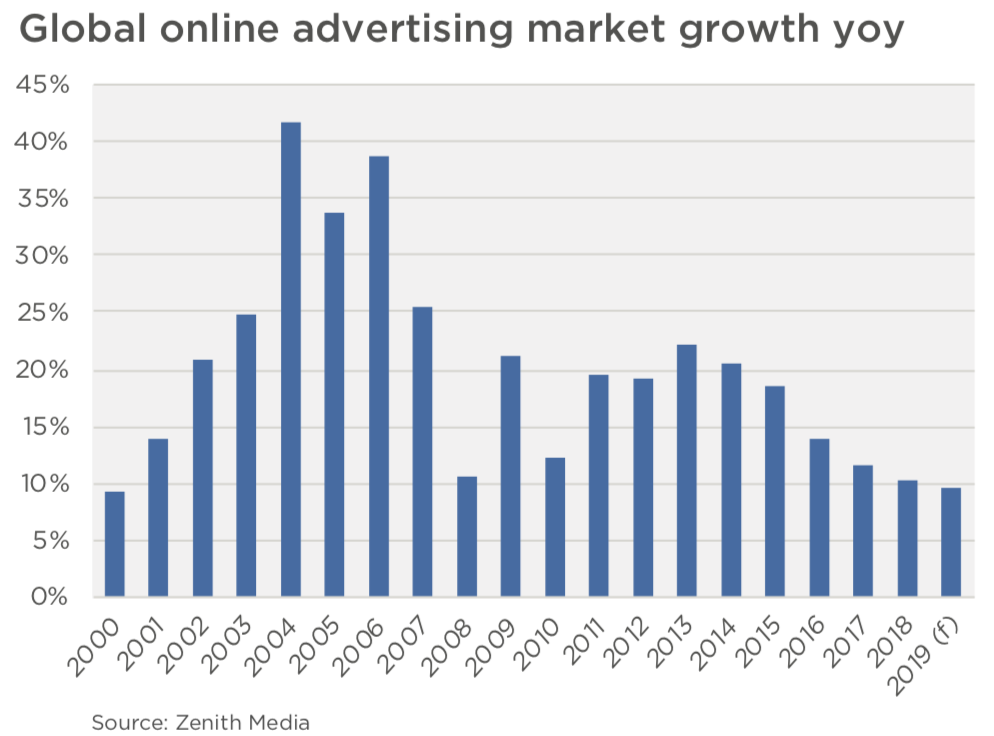
The online advertising market is growing at a healthy but decelerating rate. The mere fact that online is approaching 50 cents in every dollar of advertising globally means that the days of 15%+ growth are gone.
Google (Alphabet) is responding to a core search and online advertising franchise that is both maturing and under competitive attack by growing into new markets where it is, by definition, relatively weak. There are two types of these forays:
- into established markets with strong existing players, most commonly fellow FAANGs; and
- into nascent markets with no genuine incumbent. In the former category, Google is attempting to compete with Netflix in subscription streaming video through YouTube Plus; with Apple and Samsung in devices via its Pixel smartphone and tablets; in web hosting services with Amazon Web Services and Microsoft Azure; and with Amazon and Apple in smart speakers via Google Home.
In the frontier category are a collection of businesses that Google calls ‘Other Bets’ or ‘moonshot’ projects. This includes Waymo, Google’s self-driving car project, where it is competing with Uber and Apple as well as Tesla, Ford and General Motors. Other laudable projects include Calico, an R&D company whose mission is to extend human lifespan; Loon, delivering internet via solar-powered balloons; Wing, its drone delivery project; and Sidewalk Lab, Google’s effort to rebuild and modernise cities.
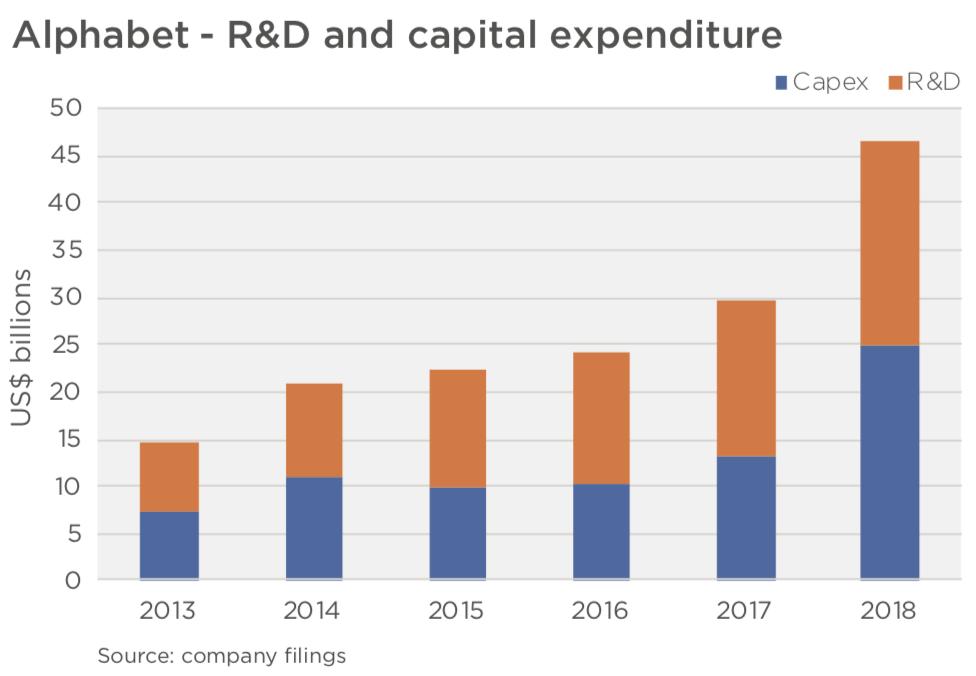
Getting to the moon is expensive, and ‘Other Bets’ reported a loss of US$1.3 billion in the March quarter, US$500 million of which was attributed just to executive stock options. The cost
of growing into new markets is also reflected in the cash flow statement of Alphabet, Google’s parent company. Waymo needs to build cars and storage facilities; Loon requires connectivity infrastructure and balloons, and Wing requires drones and charges. Alphabet’s capital expenditure has risen 7.5-fold from US$3.3 billion in 2012, equal to 30% of net profit, to US$25 billion or 81% of net profit in 2018.
[ls_content_block id=”22205″ para=”paragraphs”]