
While share index returns over time broadly match a normal distribution, returns from individual shares are highly positively skewed.
Skewness increases with the length of the holding period. Held for a decade, two-thirds of shares underperform the index. Does that mean we should search for the extreme winners?
Our conclusion – avoid the losers.
The “normal” distribution is a reasonably good fit for actual share market returns, as measured by an index
(e.g. ASX 200, S&P 500).
The distribution of outcomes is symmetrical. This means positive and negative outcomes of the same magnitude are equally like to occur.
Where the normal distribution is imperfect is in the tails extremely large positive and negative index outcomes happen far more frequently than the model would suggest.
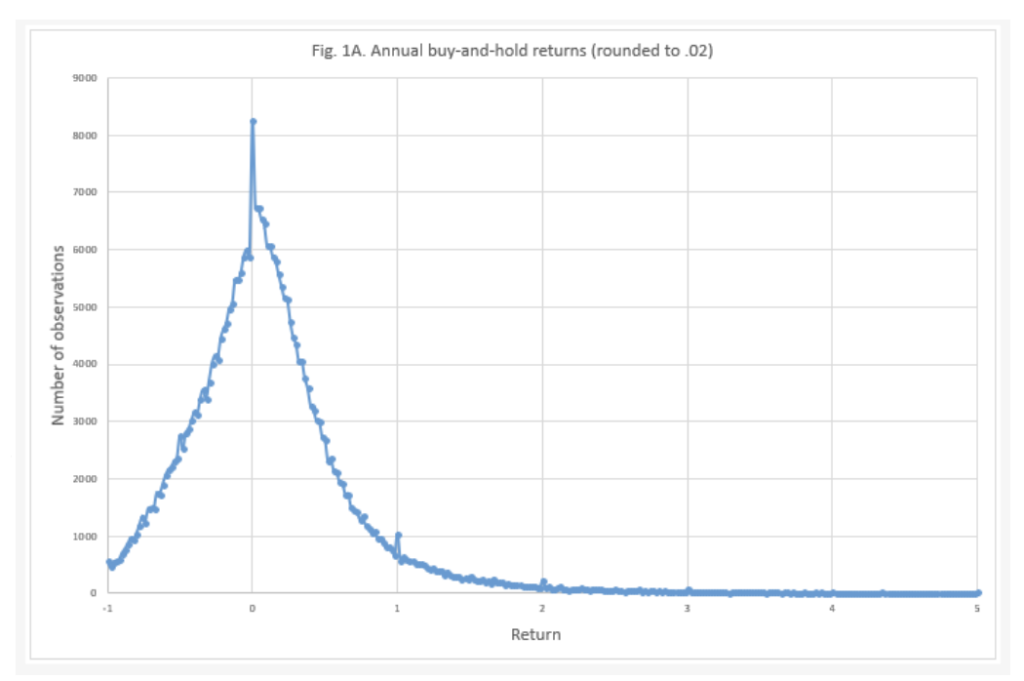
The distribution of individual stock returns is not normally distributed. In fact, the distribution is
highly skewed.

This means that the return of the average share, as measured by the median, is far less than the index return.
Hendrik Bessembinder from Arizona State University has done some wonderfully insightful work on this topic. Using data for the entire US equity market over the 90-year period from 1926 to 2016 he shows that the median annual buy-and-hold return is 5.2% pa, dramatically short of the mean return of 14.7%.
55.6% of shares underperform the index over a year.
If you think that being a patient investor takes care of this problem, think again. Skewness increases with time. Assuming they are held for a decade, 64% of shares underperform the index.
The fat tails and asymmetry in individual share returns raise interesting questions about equity risk premium when valuing shares, and how to think about and measure risk. Remember, the standard deviation measure assumes the distribution of outcomes is normal. As shown above, it is not.
How About Small Caps?
Interestingly, skewness is far greater for small shares. For the smallest decile of shares, only 42% generate a return above zero over a decade compared to 81% for the largest decile.
Also notable from Bessembinder’s work is the superior returns from unlevered non-financial firms. The average annual buy-and-hold return for all non-financial firms without leverage was 27.2%, almost double the 14.7% per year return for the index.
And Indexing?
Some commentators have concluded that skewness is an argument for indexing – if two-thirds of shares underperform over an index the odds are stacked against you, so just buy an index fund.
Others conclude that this is an argument for a strategy that tries to identify the outsized winners, the outliers at the extreme positive end of the skewed distribution.
The third point of view, and the one we endorse, is to follow a conservative approach that focuses on avoiding the extreme losers. That is, the fat negative tail of the distribution.
Fortunately, these firms share some common characteristics – they tend to be highly financially leveraged, have poor returns on invested capital, have balance sheets that have grown aggressively, and trade on very high earnings multiples. Avoiding shares like this will help you stay out of the “disaster zone” and go a long way to generating outperformance.
This article was written by Stephen Arnold, CFA, founder and Chief Investment Officer of Aoris Investment Management. Click here to download Stephen’s free Owner’s Manual.
![]()