Site menu

Search by ticker code:
Generic filters

Menu

Search by ticker code:
Generic filters

Search by ticker code:
Generic filters

Share market charts of November 2023

Cameron Gleeson of Betashares talks about S&P/ASX 200 (INDEXASX: XJO), the Nasdaq-100 (INDEXNASDAQ: NDX), and the S&P 500 (INDEXSP: .INX) and their performances over the last couple of years. Are these share prices still a buy today?

A wrap up of the charts catching our eye over the past month.

As sentiment remains wary around equity market growth we take a look at how the underlying fundamentals stack up for some of the best performing equity markets globally.

Domestically, we consider what drives returns for the S&P/ASX 200 and the risk this poses.

Finally, putting gold’s recent rally under the microscope we look for reasons why it may still go higher.

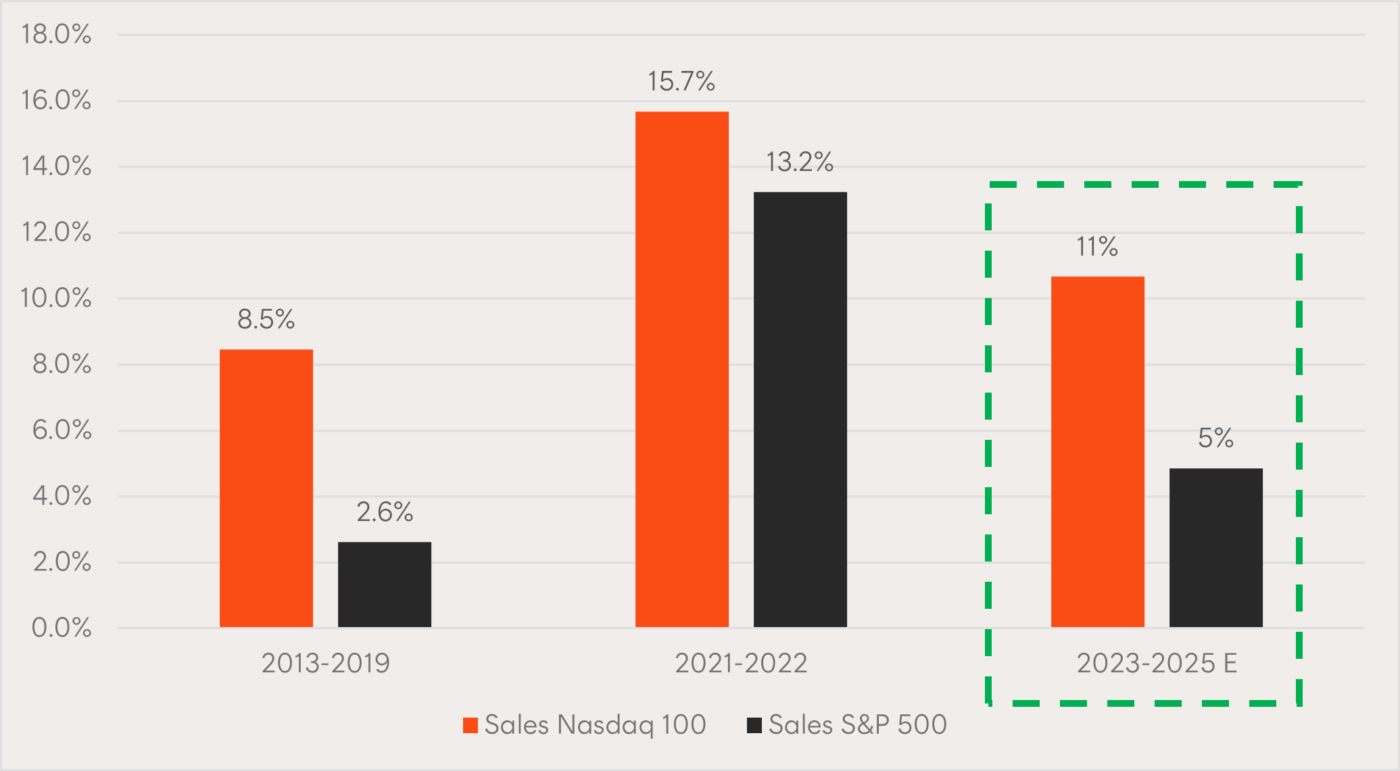
Will strong fundamental growth continue to drive the Nasdaq’s outperformance?

Focusing on the US market, the strong fundamental growth of the region’s technology companies listed on the Nasdaq-100 have driven equity market growth.

After a period of catchup by the S&P 500’s sales growth following Covid lockdowns, consensus estimates once again have the Nasdaq’s companies outpacing the rest.

Chart 1: Historical and consensus estimates of sales growth for the Nasdaq 100 and S&P 500. Past ten years and estimates of next two.

Source: Bloomberg. The chart shows historical sales growth from 2013 to 2022 and consensus forecast sales growth for the period from the end of 2023 to calendar year 2025. Actual outcomes may differ materially from forecast outcomes. No assurance is given that an investment in any Betashares ETF will deliver positive returns or outperform a particular market index. This data does not represent a revenue forecast for any ETF and does not take into account ETF fees and costs.

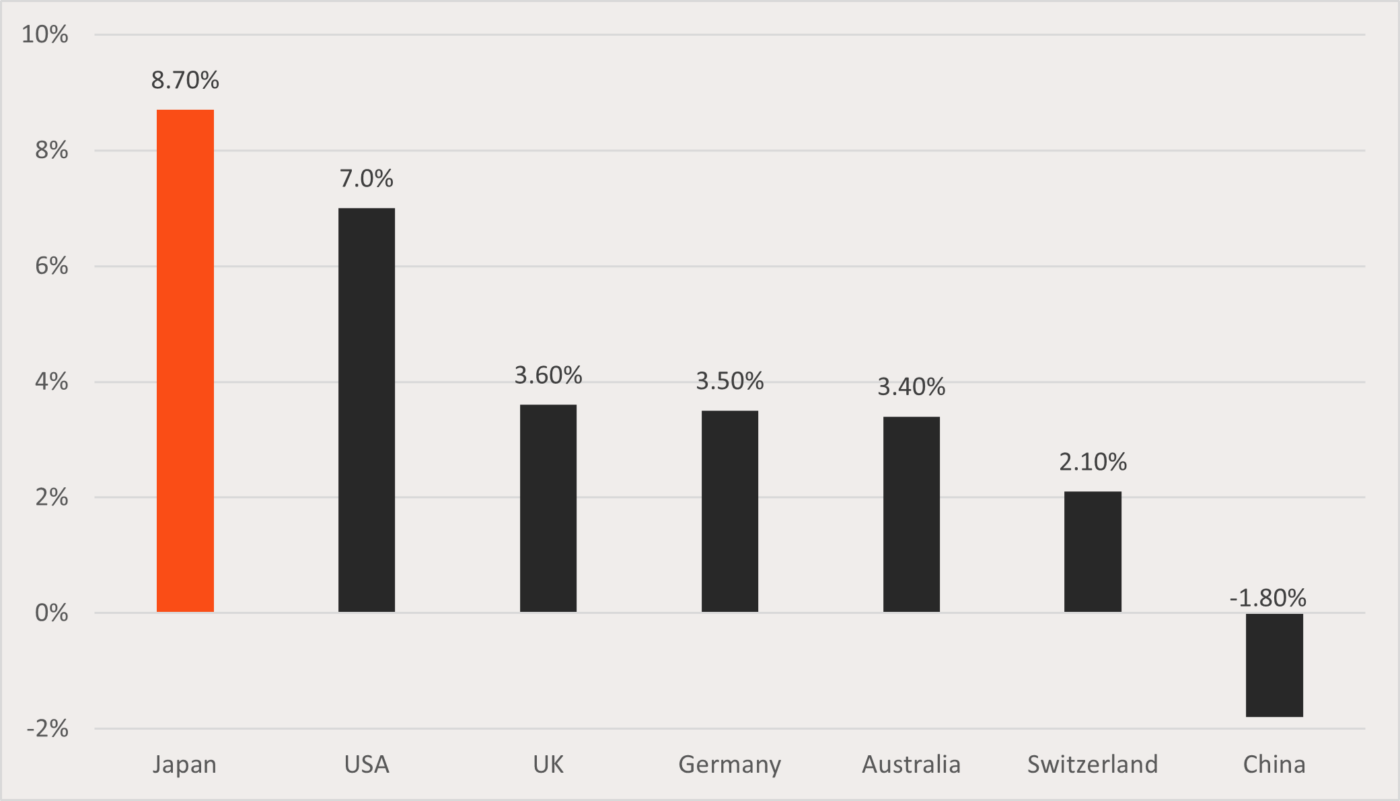
Japanese equities have been a standout for earnings growth over the past decade

Many investors closely associate Japanese equities with the term ‘the lost decades’.

However, structural corporate reforms, accommodative macroeconomic policies, and geopolitical tailwinds are starting to take hold as underlying company fundamentals improve.

Japan has been the second-best performing major equity market in 2023 to date, as highlighted by the metrics shown in the chart below.

Chart 2: Trailing 10-years earnings per share (EPS) Compound annual growth rate (CAGR), in local currency, for selected equity markets

Source: Morgan Stanley Research, Datastream, MSCI. Note EPS calculated in local currency. Based on MSCI indices. 10 years to 2023. Chart is provided for illustrative purposes. Past performance is no guarantee of future results.

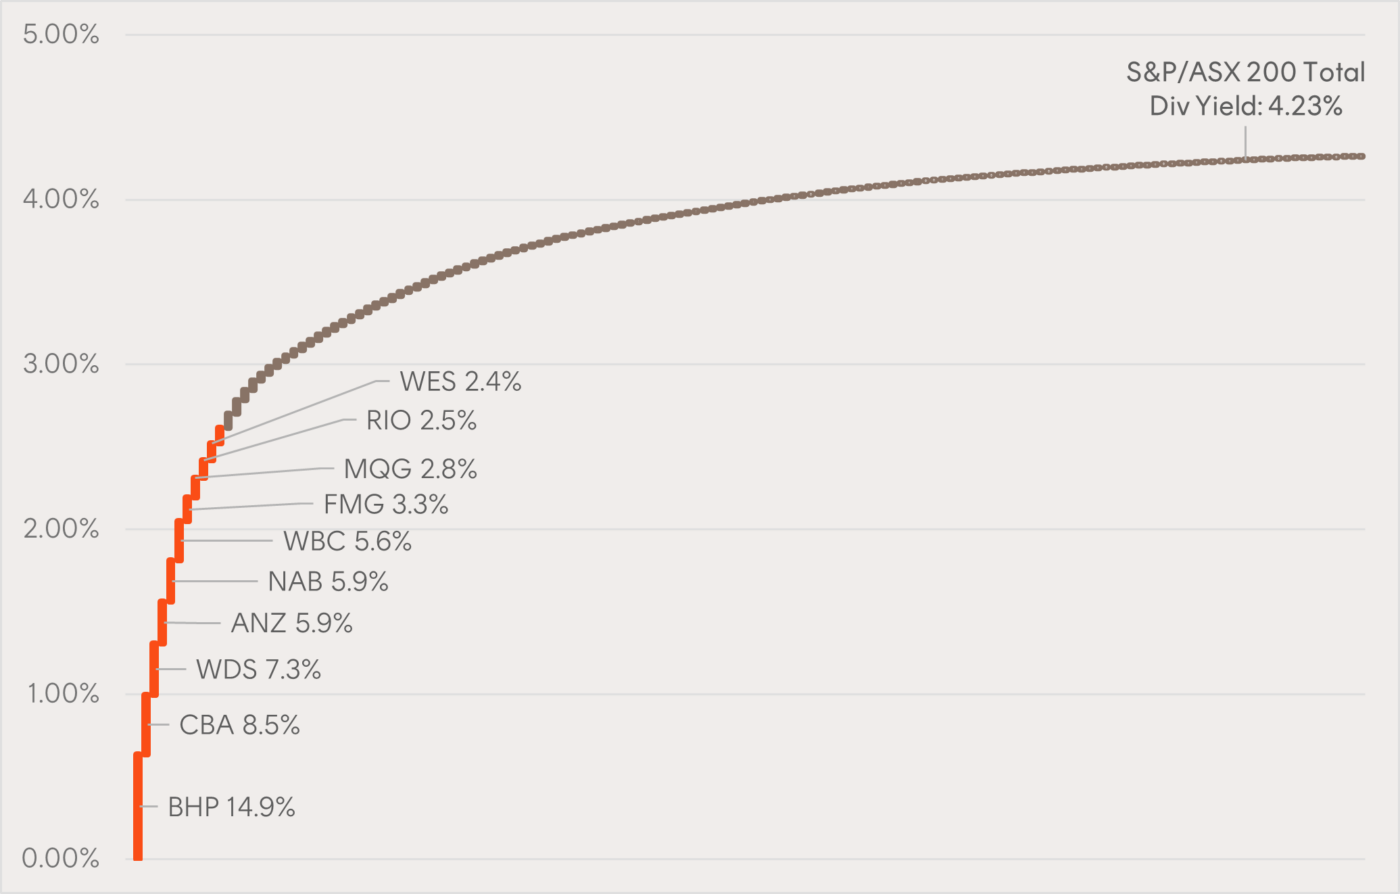
The ASX remains reliant on dividends for returns, and the dividends remain heavily reliant on ten contributors

On 1 November 2007, the S&P/ASX200 Index reached 6,828 points; on the 1 November this year it was just 10 index points higher.

If it wasn’t for dividends, the total market return over that 16-year period would have been close to zero.

The top 10 contributors currently make up 60% of the index’s dividend yield, posing a potential threat to our domestic market’s returns if these dividend yields were to fall.

Chart 3: Cumulative contribution of each stock to the trailing 12-month S&P/ASX200 Index yield (highlighting the top 10 contributors)

Source: Bloomberg, Betashares, as at 24 November 2023. Chart shows the cumulative contribution of each stock to the overall dividend yield of the index, based on each constituent’s dividends and its proportionate weight in the index as a whole. Past performance is not indicative of future performance of any index or fund. You cannot invest directly in an index.

Gold’s disconnect from its historical drivers could help bullish sentiment

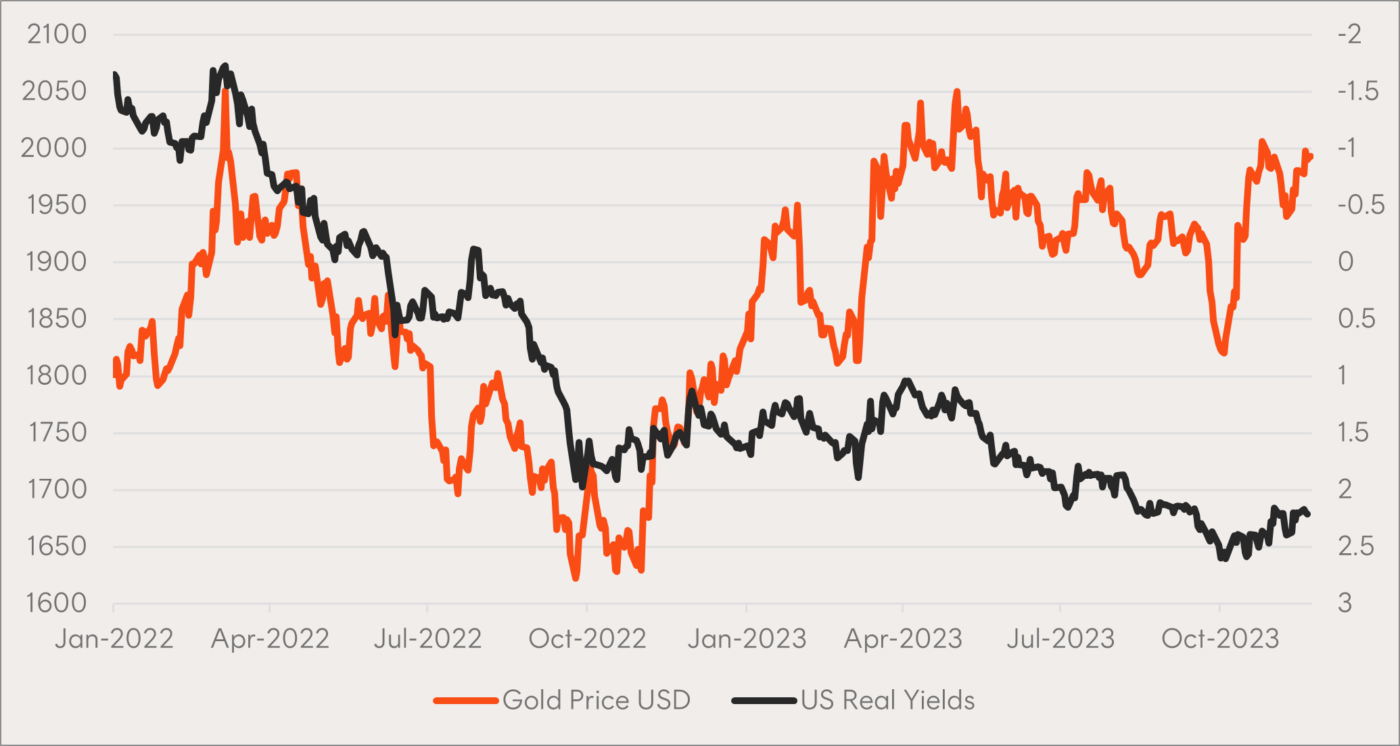
Historically, the US dollar and US real yields have tended to be two key drivers of the gold price (in US dollars).

More recently, these inverse relationships have broken down as the gold price has risen (Charts 4 and 5) while we experience US dollar strength (inversed, Chart 4) and higher real yields (inversed, Chart 5).

Many suspect this is on the back of gold’s safe haven utility and central banks buying gold in place of US dollars.

A reversal of US dollar strength or falling US real yields could potentially be a catalyst for the gold price to take another leg higher.

Chart 4: USD gold price (orange, LHS) and US dollar index (black, RHS inverted).

Source: Bloomberg, as at 24 November 2023. Past performance is not indicative of future returns. USD gold price does not take into account fees and costs of an ETF investing in this asset class.

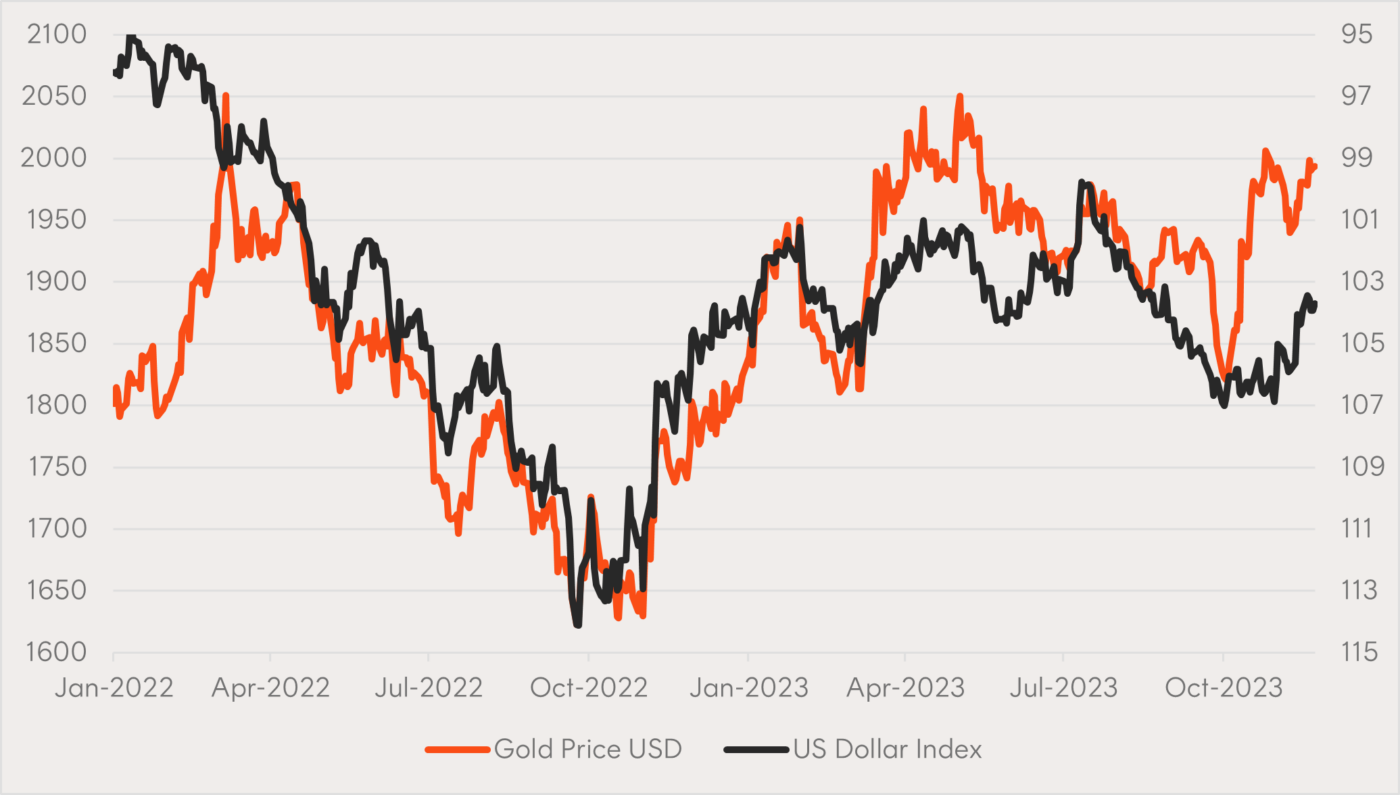
Chart 5: USD gold price (orange, LHS) and US real yields (black, RHS inverted).
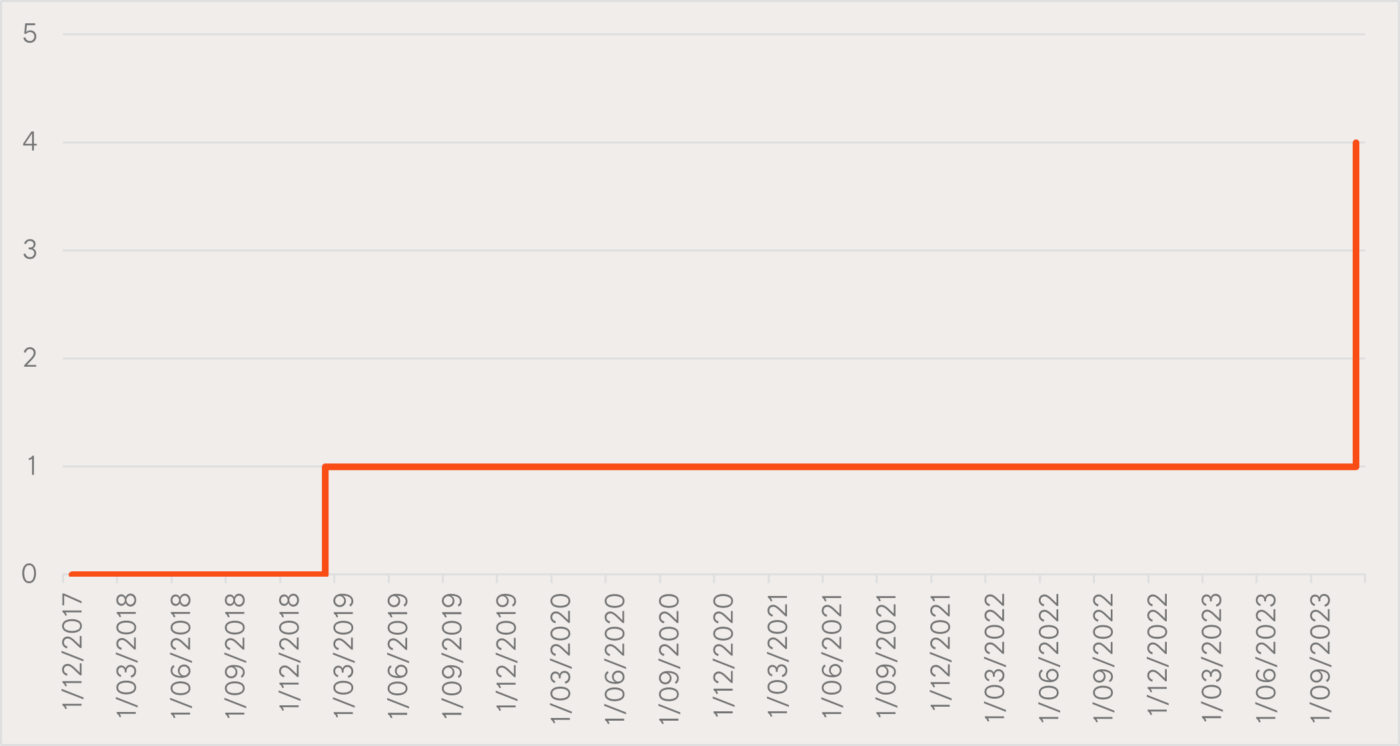
Source: Bloomberg, as at 24 November 2023. Past performance is not indicative of future returns. USD gold price does not take into account fees and costs of an ETF investing in this asset class.

5 – OpenAI

On the lighter side of charts we have enjoyed over the past month, the fiasco at OpenAI has led to a 300% increase in the cumulative number of CEOs running the business in less than a week.

Chart 6: Cumulative number of CEOs at OpenAI

Source: Betashares.


2024 ETF Playbook: Coming in to land

Download our special report to see the economic and market outlook from our Chief Economist, 12 ETF ideas for the year ahead, and 6 charts you can’t ignore in 2024.

Betashares Disclaimer: Betashares Capital Limited (ABN 78 139 566 868, AFSL 341181) is the issuer of Betashares Invest, being the IDPS-like scheme available through the Betashares Direct platform. Before opening an account or making an investment decision, read the Product Disclosure Statement and the Target Market Determination for Betashares Invest, available by emailing Customer Support at [email protected] or by phone on 1300 487 577, to consider whether the product is right for you. You may also wish to consider the relevant Target Market Determination, which sets out the class of consumers that comprise the target market for the Betashares Fund and is available at www.betashares.com.au/target-market-determinations. This information is general in nature and doesn’t take into account any person’s financial objectives, situation or needs. You should consider its appropriateness taking into account such factors and seek professional financial advice. Investments in Betashares Funds are subject to investment risk and the value of units may go up and down. The performance of any Betashares Fund is not guaranteed by Betashares or any other person. Past performance is not indicative of future performance.


Information warning: The information on this website is published by The Rask Group Pty Ltd (ABN: 36 622 810 995) is limited to factual information or (at most) general financial advice only. That means, the information and advice does not take into account your objectives, financial situation or needs. It is not specific to you, your needs, goals or objectives. Because of that, you should consider if the advice is appropriate to you and your needs, before acting on the information. If you don’t know what your needs are, you should consult a trusted and licensed financial adviser who can provide you with personal financial product advice. In addition, you should obtain and read the product disclosure statement (PDS) before making a decision to acquire a financial product. Please read our Terms and Conditions and Financial Services Guide before using this website. The Rask Group Pty Ltd is a Corporate Authorised Representative (#1280930) of AFSL #383169.


At the time of publishing, the author or their clients may have a financial interest in some of companies or securities mentioned.

Powered by

Skip to content