
The price-to-earnings (P/E) ratio is one of the most commonly used metrics in financial analysis as it helps investors understand and compare company valuations.
While the P/E ratio has been widely associated with individual equities, they’re equally as relevant to ETFs that invest in stocks.
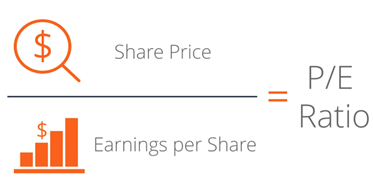
The metric is calculated by dividing the current share price by the previous 12 months’ earnings per share (EPS), which is a company’s net profit divided by the number of common shares it has outstanding.
In the context of ETFs, the P/E ratio is a composite figure derived from the valuations of the underlying companies held by the fund.
Illustrative example of a P/E ratio calculation
Let’s walk through an illustrative example of a P/E ratio calculation and what it may tell us about a company or fund.
Let’s say Company A generated $1 billion in profit in the past 12 months. It has 200 million shares outstanding, and its stock is currently trading at $50 per share.
We would apply the formula as follows:
- P/E ratio = Share price / EPS:
- EPS = Net profit / Shares outstanding
- EPS = $1,000,000,000 / 200,000,000 shares
- EPS = $5 per share
- With the stock at $50, and an EPS of $5, we can calculate the P/E ratio:
- P/E Ratio = $50 / $5
- P/E Ratio = 10
This indicates that investors would pay $10 for every $1 of Company A’s earnings for that year.
Likewise, if an ETF displays a P/E ratio of 10 – derived from the weighted average P/E ratios of its underlying companies – it implies that investors would pay $10 for every $1 of earnings generated collectively by the underlying companies held in the fund for that year.
How can the P/E ratio be used for stock and ETF valuations?
Once we know the P/E ratio of a company or ETF, we can use this information in several ways to assist in making an informed investment decision.
- Fair valuation comparisons:
- P/E ratios can help investors objectively compare one valuation aspect of similar opportunities between each other.
- For example, comparing two banks, Bank A, with a P/E of 10 and a $100 share price, and Bank B, with a P/E of 15 and a $25 share price. Despite Bank A having a higher stock price, it’s priced at a lower level relatively to current earnings than Bank B.
- This comparison can further be contextualised by referencing historical averages for these banks and the sector as a whole. This can help to establish a baseline for evaluating value within the sector.
- Assessing risk:
- P/E ratios may in some instances serve as risk indicators. Companies and ETFs with high P/E ratios may be more susceptible to sharper sell offs during market downturns due to elevated valuations.
- Conversely, ETFs with lower P/E ratios may fall comparatively less during market downturns, but they may also offer more moderate growth potential.
- Understanding market sentiment:
- P/E ratios within ETFs can mirror prevailing market sentiment.
- During periods when markets are rising, investors may be willing to pay premium prices for stocks, resulting in elevated P/E ratios. Conversely, during periods of market decline, P/E ratios may contract..
Trailing versus forward P/E ratio
It’s a well-worn adage in investing:
“Past performance is not indicative of future results”
and this rings especially true for the EPS component of the P/E equation.
The concept of P/E ratios branches into two dimensions: one based on EPS data from the past 12 months, known as the “trailing P/E ratio,” and the other relying on a company’s estimated EPS for the coming 12 months, termed the “forward P/E ratio.”
When the forward P/E ratio surpasses the current P/E ratio, it hints at an expectation of reduced future earnings.
This observation may serve as a cue for investors to assess its potential impact on their investment decisions.
P/E ratios are one tool in the investment analysis process
While the P/E ratio is a valuable metric in financial analysis, it’s crucial to recognise that it is not a “magic” number that determines an investment’s worth.
Investment professionals often consider a comprehensive array of metrics such as return on equity, debt-to-capital ratio and earnings stability.
These screening factors are used in Betashares Australian Quality ETF (ASX: AQLT) and Betashares Global Quality Leaders ETF (ASX: QLTY).
How to find P/E ratios?
Discovering P/E ratios for stocks and ETFs can conveniently be done through these methods:
Betashares ETF factsheets: To locate P/E ratios for Betashares ETFs, visit the product page of the specific ETF. P/E ratios and other relevant financial information can often be found within the factsheets provided for each ETF, offering investors valuable insights into the fund’s valuation.
Free finance websites: Numerous finance websites offer free access to P/E ratios for stocks and ETFs. Popular options include Yahoo Finance, Google Finance, and Market Index. Simply enter the stock or ETF symbol, and you’ll typically find P/E ratio information alongside other key metrics.
Within brokerage accounts: If you have a brokerage account, P/E ratios for stocks and ETFs can often be found in their individual research or profile pages.
Conclusion
The P/E ratio can help investors understand whether a stock or ETF may be fairly, under or overvalued compared to other similar opportunities in the market.
However, it’s important to understand that it’s just one piece of the investment puzzle.
Investors should factor in a diverse array of metrics and considerations to make informed decisions.
For those seeking a more holistic approach without the expertise or time required for detailed analysis, quality-oriented ETFs may offer an appealing alternative.


