

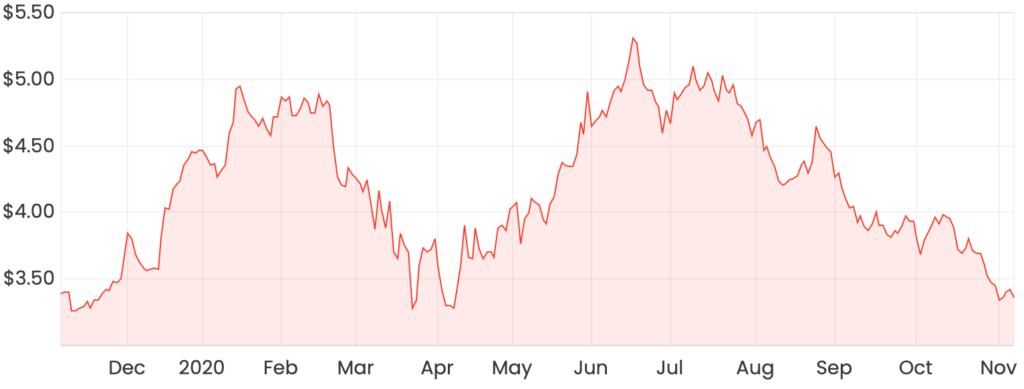
The Omni Bridgeway Ltd (ASX: OBL) share price is down almost 37% from its June high. Could this be a buying opportunity?
OBL share price chart
Omni Bridgeway merged with IMF Bentham
in November 2019 to form the world’s largest dispute resolution funder.
What does Omni Bridgeway do?
Omni Bridgeway is a global leader in disputes financing with operations in Asia, Australia, Canada, Europe, the Middle East, the UK and the US.
Omni Bridgeway provides funding to a diversified mix of cases in areas including diversified law firm portfolios, patent and intellectual property claims, commercial, insolvency, corporate, arbitration claims, appeal, whistle-blower claims and multi-party actions.
Omni Bridgeway is currently transitioning its capital structure from “balance sheet to Fund management”. In other words, Omni Bridgeway is pivoting from providing direct funding to establishing/investing in funds which will provide financing.
Omni Bridgeway currently manages seven funds. It has a strategy to “remain a meaningful minority investor in each of our Funds, to harness investment returns as an equity participant, with management and performance fee revenue from returns on third party capital”.
As at FY20, the carrying value of Omni Bridgeway’s investments was $627.93 million. Prior to merging with Omni Bridgeway, IMF Bentham had an 89% success rate across 192 cases over 18 years.
FY20 result summary
In FY20, Omni Bridgeway earned revenue of $314.3 million and net profit after tax of $17.6 million.
Omni Bridgeway reported record ‘net cash generation’ of $236.6 million. Omni Bridgeway prefers this non-IFRS (International Financial Reporting Standards) measure to identify the cash inflow from completed cases after deducting cash expenses during the period.
Net cash generation has been very lumpy over the last five years, as illustrated below.
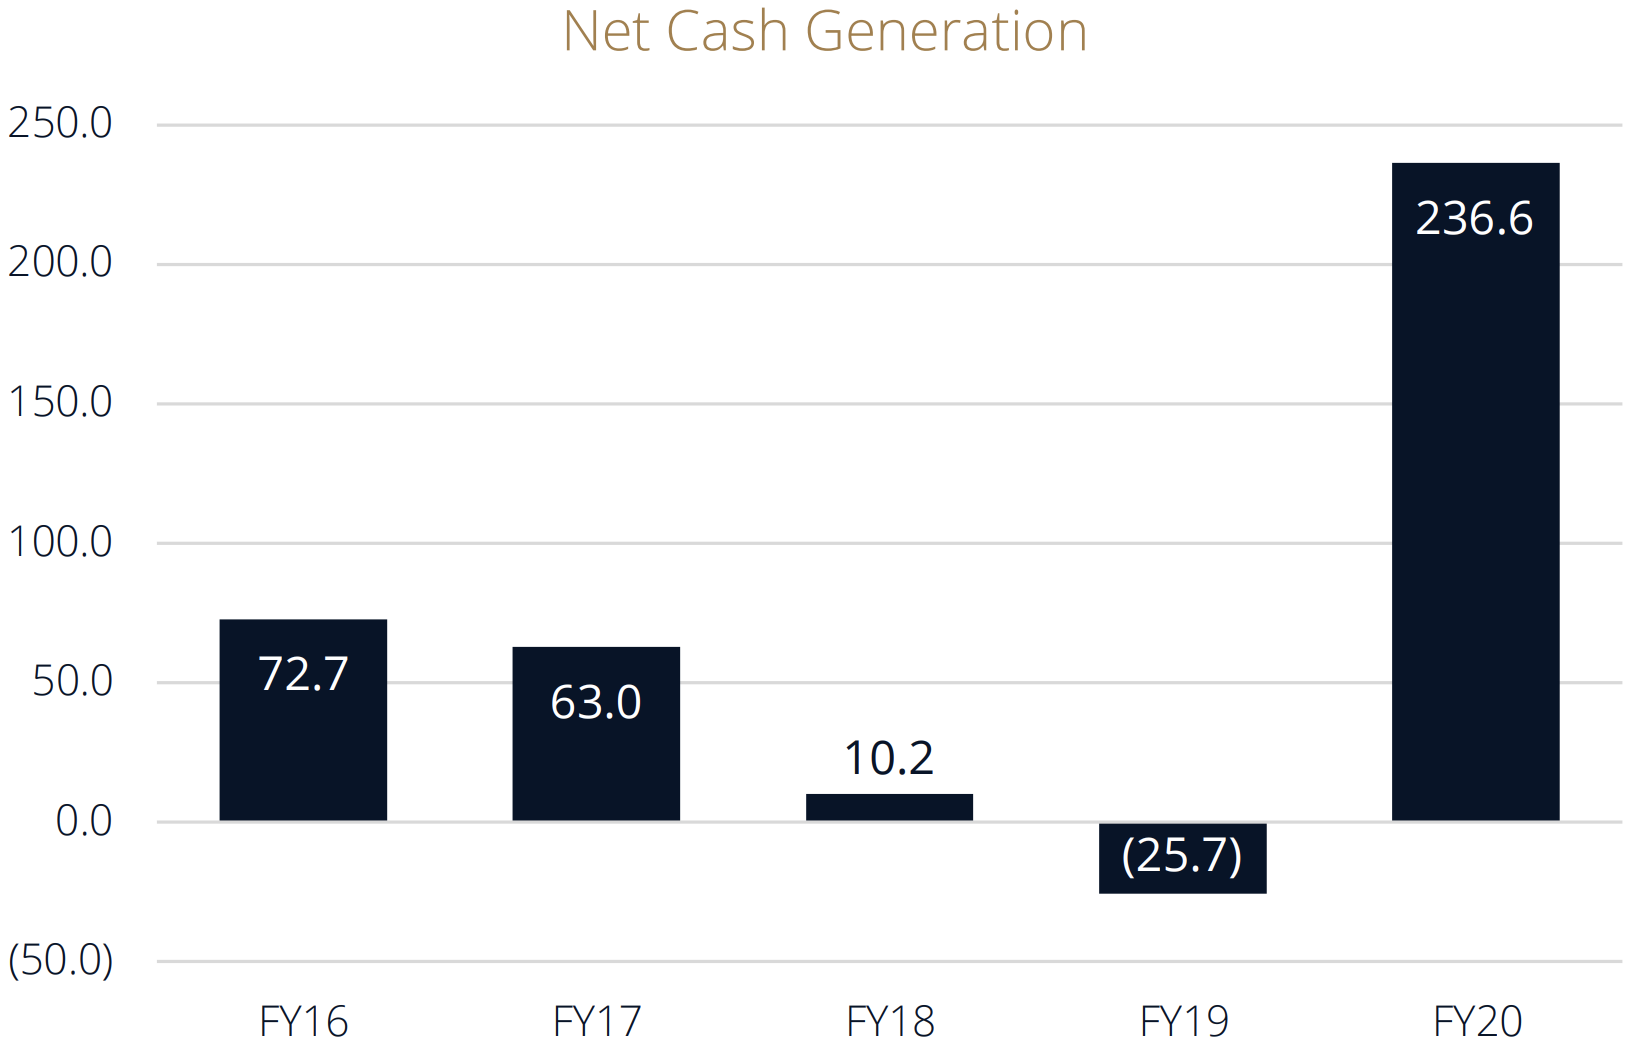
In FY20, Omni Bridgeway committed a total of $313.2 million to investments. This represents a compound annual growth rate of about 40% since 2015.
As at FY20, Omni Bridgeway had an estimated portfolio value of $15.8 billion, up 67% on FY19. Estimated portfolio value represents management’s estimate of potential future returns and is subject to change over time.
High return on invested capital
Omni Bridgeway has historically earned a high return on invested capital (ROIC).
From inception to the end of FY20, Omni Bridgeway had completed 227 investments. On these investments, the group has earned a ROIC of 1.32 times (excluding overheads) with an average investment period of 2.7 years.
I am sure most of us would be delighted to earn returns of 132% on an investment in less than 3 years!
Are Omni Bridgeway shares a buy?
In my view, Omni Bridgeway is an interesting business offering exposure to litigation funding, an asset class with “returns independent of financial markets and/or economic cycle”.
At the current share price of $3.46, Omni Bridgeway has a market capitalisation of $853.6 million. Assuming net cash generation is a reasonable estimate of free cash flow, we can calculate an estimated free cash flow yield.
Dividing FY20 net cash generation of $236.6 million by the current market capitalisation, we get an estimated (and very high) trailing free cash flow yield of 27.7%.
While this seems like a great free cash flow yield, my estimated FY20 free cash flow might not be indicative of future free cash flows, especially considering the variability in net cash generation between FY16 and FY20.
All in all, I would require greater confidence in my ability to estimate Omni Bridgeway’s future cash flows before investing.
For the time being, check out other ASX growth share ideas from the Rask Media team.


