

Is the National Australia Bank Ltd (ASX: NAB) share price really worth just $20? Or is the NAB share price overvalued?
No one can tell you for sure whether now is the perfect time to buy NAB shares, or even Westpac Banking Corp (ASX: WBC), ANZ Banking Group (ASX: ANZ) and Commonwealth Bank of Australia
(ASX: CBA). The best we can do is conduct our research into the business, the sector and the economy to then try and determine the cash flows. The same applies to any S&P/ASX 200 (INDEXASX: XJO) listed company.
Given NAB is a bank we’ll use dividends instead of free cash flow.
Before we get to the valuations, remember that even with bank shares, which have been some of the ASX’s best performers over the past 30 years, they are not without their risks, and nothing is ever gauranteed in the stock market. What’s more, shares like NAB or WBC often appear undervalued, at least on a PE ratio basis because they are highly regulated, tend to experience slower profit growth, pay more of their profit back to shareholders in dividends and are typically more ‘mature’ businesses.
NAB share price
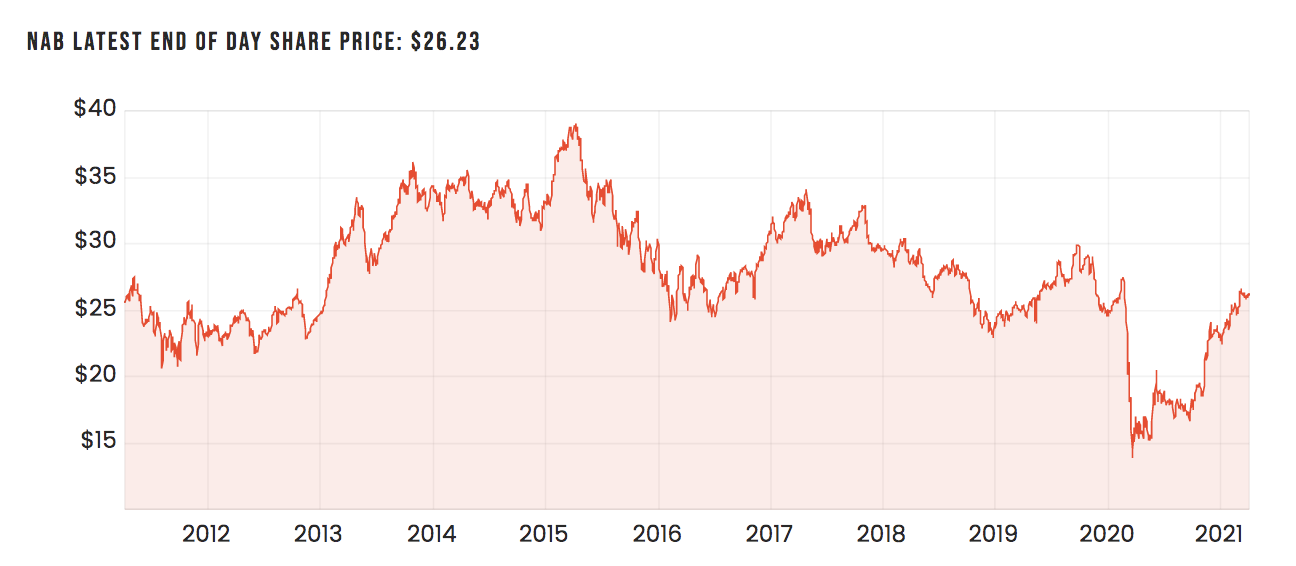
Here are two quick ways to determine what a good price for NAB shares might be.
NAB’s PE ratio
Using the NAB share price today, together with the earnings per share data from its 2020 financial year, we can calculate the company’s PE ratio to be 32.6x. That compares to the banking sector average PE of 24x.
Reversing the logic here, we can take the earnings per share (EPS) ($0.805) and multiply it by the ‘mean average’ valuation for the sector. This results in a ‘sector-adjusted’ share valuation of $19.59.
NAB’s dividends
The dividend discount model or DDM is different from ratio valuation like PE because the model makes forecasts into the future, and uses dividends instead of profit or free cash flow.
Using our DDM modelling, we will assume NAB’s share dividend payment grows at a consistent rate in perpetuity (i.e. forever) at a yearly rate between 2% and 3%. We won’t include franking credits (which boost the valuation).
Next, we have to pick a yearly ‘risk’ rate to discount the dividend payments back into today’s dollars. The higher the ‘risk’ rate, the lower the NAB share price valuation. We’ve used an average rate for dividend growth and a risk rate between 6% and 11%. Meaning, we’ve done multiple valuations (at varying rates for growth and risk) then averaged them all.
This simple DDM valuation of NAB shares comes to $11.44. However, let’s exclude the impact of COVID. Using an ‘adjusted’ dividend payment of $1.12 per share, which uses analyst consensus forecasts for the year ahead, the NAB share price valuation goes to $20.08. The valuation compares to NAB’s current share price of $26.24.
Valuation isn’t everything
Be mindful that the two models used here are only the starting point of the process for analysing and valuing a bank share like NAB.
It’s good practice to read at least three years of annual reports, jot down your thoughts/research and set out your thesis/expectations based on what management is saying.
Indeed, a useful trick is studying management’s language in presentations and videos. Is the CEO or director candid and honest? Does he/she use lots of jargon and never answer a straight question? Finally, read articles and research from good analysts you respect, and when you do, seek out people who disagree with you. These voices are often the most important in share analysis.
These are just a handful of the best strategies to use alongside your valuation tools to determine if you’re making a mistake — hopefully, before you make a mistake! To get our top analyst’s #1 medical technical stock, keep reading.


