
When Warren Buffett began purchasing Berkshire Hathaway Inc (NYSE: BRK) shares in the early 1960s at ~$7.50 per share, the market capitalisation was ~$8.5 million.
The prospect of Berkshire Hathaway being worth $543 billion some 60 years hence would have seemed insane to Buffett even in his most ambitious daydreams. To be fair, there are about 37% more shares on issue today than there were when he commenced purchasing, but even if we factor for that, ~$8.5 million became ~$395 billion in roughly 60 years.
We point this fact out as the power of high-rate compounding over long durations tends to fracture even the most mathematically adept human brain. To attempt to circumvent this flaw most of our brains seem prone to, we thought it would be worth looking a long way out at what some of the larger holdings we expect to still hold in many years’ time might need to do to become >$10 billion businesses (hence the “Eleven Figures” reference in the title). We hope to reprise the piece in a few years’ time with a “Searching for Twelve Figures” series…
$10 billion has no special significance other than the fact it is a long way off for any of our portfolio companies, with the largest being Dicker Data Ltd (ASX: DDR), which is worth ~$1.8 billion and would therefore need to grow its value by ~5.5 times to meet the target threshold.
I was given to contemplating earlier this month the fact that our former portfolio holding Reece Group Ltd (ASX: REH) is now homing in on a $10 billion valuation. I remember visiting numerous REH stores in around 1990 with my father as I worked with him during the school holidays. I ruminated this month on what sort of foresight might have been required to imagine in 1990 when REH was earning a few million dollars of after-tax profit had a market capitalisation of ~$30 million that the business in the not too distant future might be valued at $10 billion.
In 1998, the REH share price roughly doubled after the release of an explosive 45% increase in FY98 profits from $11.9 million to $17.3 million. Now 10 times as valuable as in 1990, you were paying ~$300 million in market capitalisation, surely the business was fully valued?
In the pre-GFC bull market of 2007, the market capitalisation of REH had again risen almost 10-fold and now approached $3 billion, roughly 100 times what it was when I first put my grubby thirteen-year-old elbows on the worn laminate counters about 17 years earlier. Had I invested the $400 I earned that school holidays as a 13-year-old working with my Father in REH stock, I’d have had turned it into about $40,000 in time for my 30th birthday (not to mention the dividend stream).
Fast-forward another 13 years and REH’s market capitalisation has more than tripled again, slowing the growth rate from the prior decades, but still growing at a handsome clip. The 1990 buyer of REH stock at (split-adjusted) $0.25 today holds a share worth $13.50 and has had their original capital returned multiple times over in dividends.
To think about a $10 billion valuation for our portfolio companies, we will contemplate the level of earnings that might be required to justify such a valuation, then attempt to decide how long the business might need to get to such a level of earnings.
Almost every estimate we make in the series will be wrong, often by wide margins, but to derive a useful valuation, we need to have some fundamental basis for our thinking.
When Charlie Munger has been asked why he is such a successful investor, he offers “My guesses are better than yours” as an explanation. This seems a flippant statement on the surface, but to ensure our “guesses” are better (and therefore more profitable) than the median market participants guesses, we need to ensure they are made within a good framework and not pulled from our derrieres.
The first of our holdings we will examine is Redbubble Ltd (ASX: RBL). The business has this month through a meaningful addition to our holding and some share price appreciation become our second-largest holding.
The original piece below was written at the time I was adding to our holdings, at the beginning of this month, and uses a share price of $4 per share, which is just a little more than the average price we paid to add to our RBL holding in November.
RBL at $4 per share has just shy of a $1.1 billion market capitalisation. At the September quarter update, the cash balance was $85.4 million. In round figures, the enterprise valuation is ~$1 billion. The September quarter saw the business generate EBITDA of $25.7 million from “marketplace revenue” (i.e. removes the artist’s share of margin) of $147.5 million. Because revenues have grown so swiftly through the COVID period with an acceleration of the adoption of online shopping, it is difficult to ascertain the correct number to describe as the current “underlying earnings power” of the business. With that said, the September quarter is typically the weakest quarter of the year, we think the run-rate revenues and EBITDA can probably be roughly annualised.
We are modelling something roughly like this for the FY21 year:
- Q1 = $147.5m revenue ($68.4m pcp) = $25.7m EBITDA ($1.4m pcp) (n.b. these are the actuals from Q1)
- Q2 = $197.5m revenue ($109.8m pcp) = $38.8m EBITDA ($6.4m pcp)
- Q3 = $130m revenue ($65.6m pcp) = $18.5m EBITDA (-$3.3m pcp)
- Q4 = $125m revenue ($103.3m pcp) = $17.0m EBITDA ($8.4m pcp)
- FY2021 = $600m revenue ($348.9m pcp) = $100m EBITDA ($15.3m pcp)
Our estimate of a 72% FY2021 increase in revenue resulting in an estimated 554% increase in EBITDA indicates why we are excited about RBL, that type of operating leverage is seldom found, and more seldom yet in a business with as large an addressable market as RBL’s.
A key comparator business for RBL is Etsy Inc (NASDAQ: ETSY), whose CEO made this statement earlier this year: “When we pull back and look at what we’ve learned over the past three months, it reinforces my belief that the size of Etsy’s addressable market starts with a T, not with a B.”
If he is correct, one only need capture a small fraction of a market valued at a trillion dollars to have a business that has an “eleven figures” valuation.
Based on our estimate of $100 million of EBITDA for FY2021, at a $1 billion Enterprise Value (EV), we added to our holding in November at what we estimate was 10x EV/EBITDA. For comparison, REH, which I mentioned early in this piece, is trading at about 13x EV/EBITDA and clearly has nothing like the growth opportunities ahead that RBL has. If REH can grow EBITDA at a rate between 10 – 20% for the next few years, most REH investors will be quite pleased with that. We think RBL can grow at much more like the rate of the REH of my teenage years than the REH of my middle age.
For example, assume the above estimate of $600 million revenue & $100 million EBITDA proves accurate (it will not, as I have repeatedly said, but it might be in the ballpark…). Then in the FY22 RBL will be cycling a revenue base that had the tailwind of COVID stimulus packages and what will likely prove to be “non-recurring” revenues, such as masks, which if not disappearing from the revenue base next year will at least be greatly diminished. The fact that they have pivoted so quickly to a new opportunity does, however, speak to the incredible adaptability of the business model.
Given these factors, we do not expect the >50% revenue CAGR (compound annual growth rate) from the last 8 years is likely to be repeated in either FY22 or beyond. We do think there is a permanent structural trend towards both online shopping and product personalisation that will see RBL grow at high rates for many years. With the disappearance of most mask revenue, we are estimating the FY22 revenue will be something like $660-680 million.
We doubt the GPAPA (gross profit after paid acquisition) margin of 33% earned in Q1 can be sustained. We do think that there are benefits to scale and are modelling the GPAPA margin settling at ~30%. This implies ~$198-204 million of GPAPA. The OPEX was $21.1 million in the September quarter, and after the recent “cost-out” program, should be held at ~$85-88 million for FY22. This gives us an FY22 estimated EBITDA range of $110 million – $119 million.
To look out we need to make some assumptions about growth in costs and revenues. We will present this in the tables below based on a “high/low” basis for “near-perfect execution” and “solid execution”. From FY23, the revenue should resume a trajectory closer to the last five years, which was ~37.5% (this CAGR to be fair included a small acquisition in TeePublic).
For conservatism, we are going to use a 15% bottom of the range (it would be surprising if revenue growth slowed below this level) and a 25% top end of the range (we would be delighted to be wrong on the upside) for revenue growth. We will assume GPAPA is constant at 30%, but scale is an advantage, and this could be conservative if they grow swiftly. For OPEX, the conservative estimate will be that OPEX grows at 60% of revenue growth rate (this has been about the historic relationship), our aggressive estimate will be that OPEX can be restrained at 40% of revenue (this should be possible as scale improves efficiency).
The good thing about setting out a range of forecasts is we can revisit them to adjust based on the actual results as they arrive and it gives us a sense of what the future looks like under various alternatives. The reason I like RBL at present is that even under quite modest assumptions, quite an excellent outcome can be delivered.
RBL – Solid Execution:
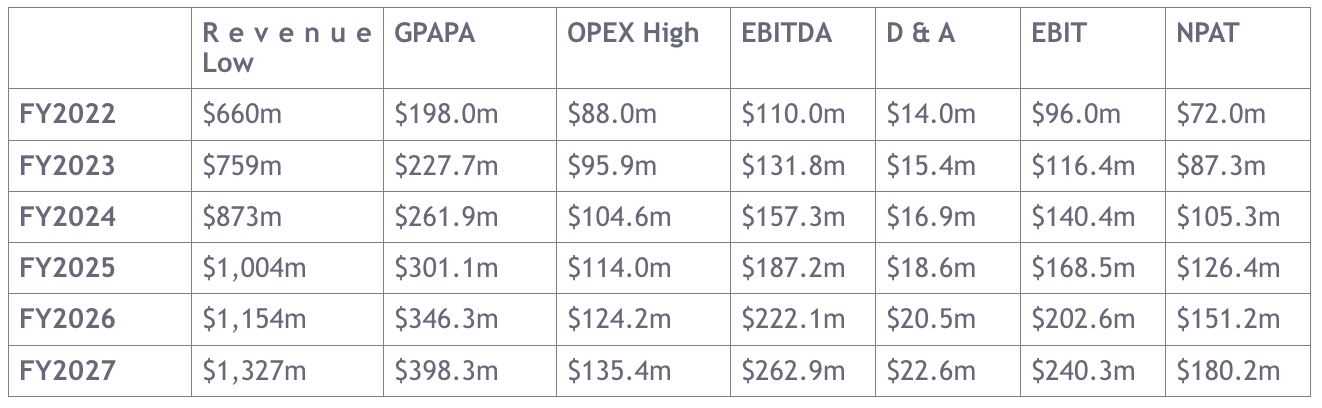
Based on “Solid Execution”, with revenues growing at 15% and OPEX growing at 9% (60% of the rate of revenue), between now and FY2027, NPAT would grow to $180.2 million in FY2027 (we have assumed a 25% global tax rate). The NPAT growth under this assumption is ~20% per annum over the 5 years examined. Knowing what multiple the market will be willing to pay at any point in the future is always the twin “Achilles heel” (along with the accuracy of the growth assumptions used) of any “DCF-style” valuation.
Assuming the interest rates of the world are not meaningfully different to where they are today, the range of earnings multiples market participants would likely apply to earnings that have traveled the path set out in the above table should be between 20-25x NPAT. It is hard to imagine a multiple of less than 20x is applied, much easier with the way the market is currently valuing good businesses to assume a multiple of more than 25x is applied.
- 20 x $180.2 million is $3,604 million. This equates to an EV/EBITDA of 16.5x (assuming all interim earnings are retained).
- 25 x $180.2 million is $4,505 million. This equates to an EV/EBITDA of 19.9x (assuming all interim earnings are retained).
Both above calculations do not allow for the distribution of the $722 million in accumulated earnings over the period. If we add that into the EV, we get $4,326 million – $5,227 million. So “solid execution” only gets us about halfway to our goal of eleven figures. Based on the fund’s purchases this month at a $1 billion EV, “solid execution” does however offer an annualised return of 23.3% – 26.7%, which is perfectly excellent.
What then if they execute a little better?
RBL – Near Perfect Execution:
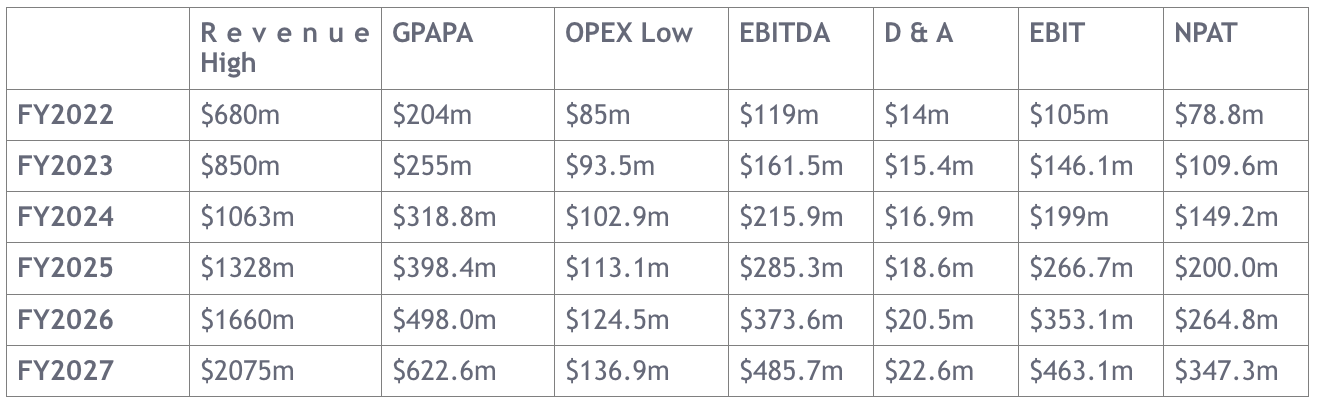
Based on “Near Perfect Execution”, with revenues growing at 25% and OPEX growing at 10% (40% of the rate of revenue), between now and FY2027, NPAT would grow to $347.3 million in FY2027 (we have again assumed a 25% global tax rate). The NPAT growth under this assumption is almost 35% per annum over the 5 years examined, a rate that precious few businesses achieve, particularly off a starting point of nearly $80 million in earnings.
Again, the finishing multiple is a difficult decision. Teleport me to 2027 and a business that has ~$350 million of after-tax earnings that is nearly five times the earnings of only five years prior and it would be hard to imagine the multiple ascribed that business is not in the 30-35x range. For context, Pro Medicus Ltd (ASX: PME) is a business of similarly excellent quality as RBL. It has grown its per-share earnings by a 37% CAGR in the past 4 years and trades at 134x last year’s earnings and about 100x next year’s estimated earnings.
- 25 x $347.3 million is $8,683 million. This equates to an EV/EBITDA of 20.2x (assuming all earnings are retained).
- 30 x $347.3 million is $10,419 million. This equates to an EV/EBITDA of 23.8x (assuming all earnings are retained).
Both calculations do not allow for the distribution of the $1,150 million in accumulated earnings over the period. If we add that into the EV, we get $9,832 million – $11,569 million. “Near Perfect Execution” gets us comfortably to our goal of eleven figures at the top end of the valuation range, and quite close at the bottom.
Furthermore, based on the funds purchases this month at a $1 billion EV, this outcome offers an annualised return of 38.6% – 41.9%, at either end of the range, which is simply breathtaking and demonstrates why the ideal business to own is one with an excellent business model and a huge addressable market.
I will stress for a final time that the estimates used above will undoubtedly be wrong, our steadfast hope is they are wrong to the upside, but that may not be the case. Despite the addition of mobile applications that change the way users engage with RBL, the business is still somewhat vulnerable to the capricious way Google sometimes change their search algorithms. The business is the strongest and least vulnerable it has ever been, but technology evolves at a breathtaking pace and there may be a challenger waiting in the wings to torpedo the estimates we made above.
With that said, marketplace businesses are incredibly difficult to create, venture capital hurls billions of dollars at such businesses every year, nearly all fail. Once they pass the point of self-sustaining commercialisation, however, as RBL has, they sit atop a value-creation machine few businesses possess.
What Should RBL Management Do?
RBL has become a business that gushes more cash than management will be reasonably able to deploy into growth opportunities. Despite the successful acquisition of TeePublic, our preference as shareholders would not be to use any of this excess cash for acquisitions unless there is something genuinely compelling that offers intangible benefits beyond the scope of just additional scale. Given a preponderance of RBL earnings will be generated overseas, any dividends the business was able to pay would be unfranked, which is likewise undesirable to Australian shareholders. Dividends should only be declared up to the level they can be fully franked.
They may not have sat down and cogitated on the wealth creation machine they have built, but if I were on the RBL board, I would be sitting down to examine whether outcomes in the ranges posited above are realistic. If they are, the best pathway to value creation would be extremely aggressive buybacks of their stock for as long as the stock remains valued well below intrinsic value. Based on the high/low EV/EBITDA set out above, our estimate of the intrinsic value is currently $6.50-$9.10.
Were I on the RBL board, I would argue for extremely aggressive buybacks below the bottom end of that range, becoming steadily less aggressive as the valuation approached the top end of the range.
The ZFC update
CEO of The ZFC (Zero Fund Collective), Brad Hughes and I travelled to Melbourne the day borders opened to talk with prospective partner fund managers. It was a pleasure to finally be able to cross the border. Brad has been consistently surprised (to the upside) about the quality of investors that are willing to contemplate engaging with the ZFC philosophy and we increasingly expect to build something quite special.
We are travelling to Brisbane on 7 & 8 December on a similar mission as the Melbourne visit. Should anyone wish to contact regarding an appointment whom we have not yet reached; please contact me. We are happy to extend a day if our Brisvegas schedule overfills.
We are likewise interested to talk to any prospective investors, particularly those of scale, such as asset allocation businesses, family offices, or financial planning groups. The ZFC will be an excellent way for larger asset allocators to engage at institutional scale with a group of skilled fund managers primarily focused on the smaller end of the market which can provide advantages to direct investment. The ZFC will also provide free of charge a research focus to such organisations, whereby we will explain which of our member managers can best fill a targeted asset allocation goal. We look forward to being positioned to make further updates as The ZFC progresses.
This article was written by Tony Hansen, Chief Investment Officer at EGP Capital. Click here to speak with Tony.


