
The finance industry loves labels: Nifty-Fifty, TMT, BRICS, FANGS, Next Eleven and Fragile Five to name a few. They become an accepted part of financial market nomenclature for a period, then most disappear from the conversation, a bit like the Atkins Diet, and eventually become quaint markers in time that help to define an era.
The terms ‘growth’ and ‘value’, however, have had more staying power and are used extensively in financial market commentary. Frequently we read that ‘growth is outperforming value’, a particular investment firm is a ‘value manager’, or a certain company is a ‘growth stock’.
These terms are used in ways that suggest you can divide stocks and investors into two opposing tribes, like Democrats and Republicans or the Montagues and the Capulets. These distinctions are nonsense. They are helpful neither in understanding the character of particular investments, nor the character of specific investment managers.
The first reason these labels lack genuine meaning is the absence of a universally-accepted definition. Let’s jump over this hurdle by picking one. Standard & Poor’s (S&P) creates indexes that quantitatively select stocks based on specific characteristics or ‘factors’. Its factor indexes define growth and value each based on three variables:
Growth
- Three-year growth in sales per share
- Three-year growth in earnings per share
- Price momentum
Value
- Price-to-book
- Price-to-earnings one year forward
- Enterprise value-to-cashflow from operations
With the benefit of a definition, let’s now look at the significant shortcomings of each label, starting with growth.
Growth
The S&P US Growth Index is designed to capture those stocks whose earnings are expected to grow at an above-average rate. Let’s look at whether the three growth variables do indeed correlate with future earnings growth.
1. Three-year growth in sales per share
The relationship between actual sales per share growth and future earnings per share (EPS) growth is not linear. In fact, there isn’t one. To explore this, we took the 733 US companies that have a market capitalisation greater than US$5b and more than seven years’ history as a listed company. We divided them into five groups ranked by annualised sales growth over 2011 to 2014 and looked at the EPS growth over the following three years.
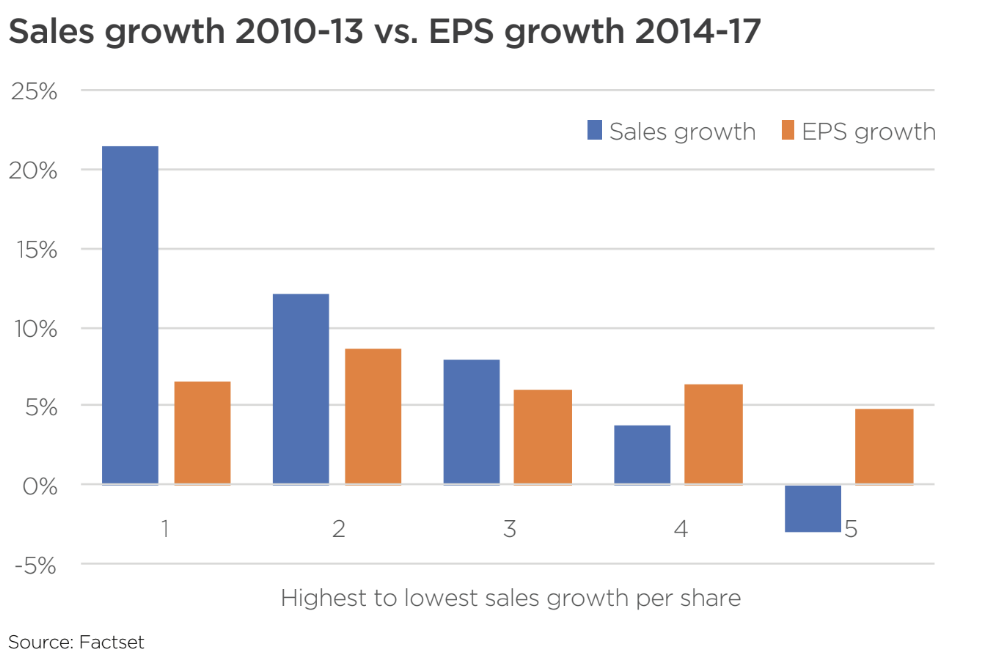
The absence of any correlation is clear. Historic sales growth (in the blue bars) tells us nothing about future earnings growth (in orange). Interestingly, and perhaps counterintuitively, the companies that had grown sales per share in the fastest tier, with a median growth of 21.4%, generated EPS growth at a rate materially below tier 2, whose sales growth was about half as fast. Median earnings growth barely differed between sales growth in quintiles 1, 3 and 4.
Moreover, comparing the fastest and slowest growing quintiles, three-year annualised sales growth differed by almost 25% p.a., yet this translated to a difference in EPS growth of just 1.7% p.a.
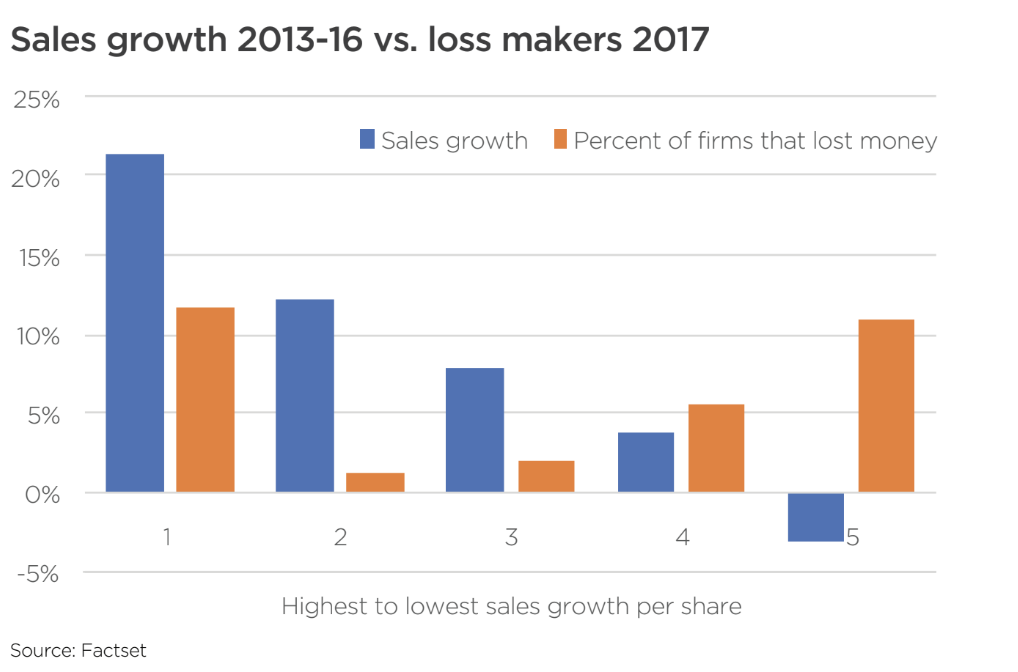
Rapidly expanding businesses often run into trouble. The graph below shows that of the group of companies with the fastest sales growth over three years to 2016, one in ten of them generated a loss in the following year, far higher than the middle three groups of ‘moderate growers’.
2. Three-year growth in earnings per share
If historic sales growth is no help as a predictor of future EPS growth, then perhaps historic EPS growth will do a better job.
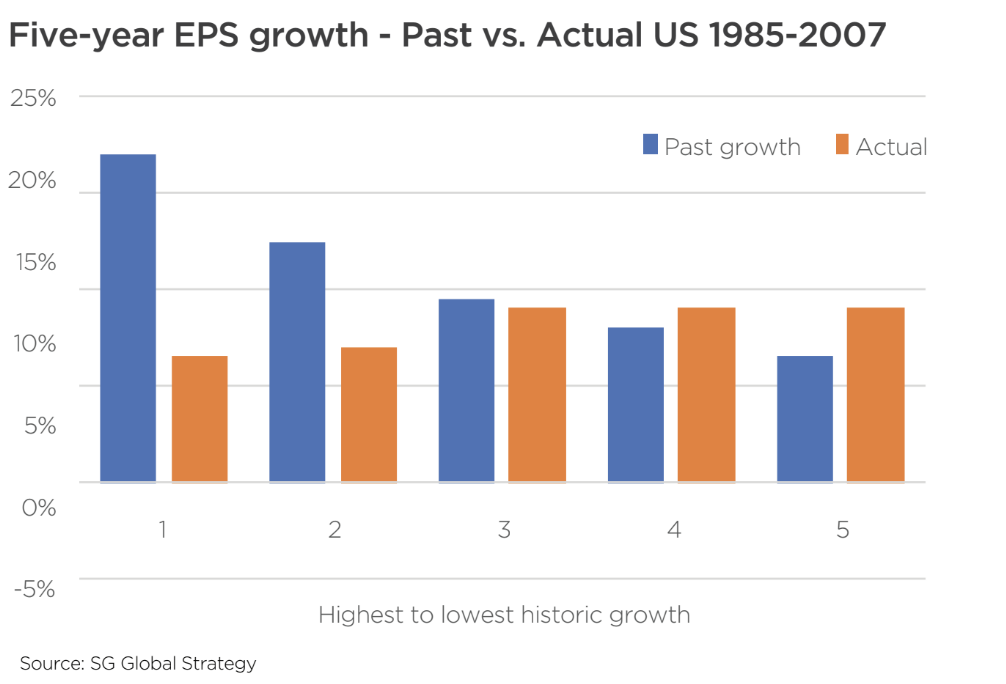
Société Générale’s Global Strategy team examined the relationship between trailing five-year EPS growth and future five-year EPS growth over the 22 years to 2007 (published in Value Investing by James Montier, 2009). They found no positive correlation between past and future growth. In fact, firms with the highest historic EPS growth had, on average, the lowest future growth.
Louis Chan from the University of Illinois looked at past and future growth in US companies over 1951 to 1998 (‘The Level and Persistence of Growth Rates’, The Journal of Finance, April 2003). He found that firms with superior EPS growth over three and five years did not show persistence into the following periods. So, as tempting as it may be to rely on it, historic EPS growth does not help identify companies with above-average future earnings growth.
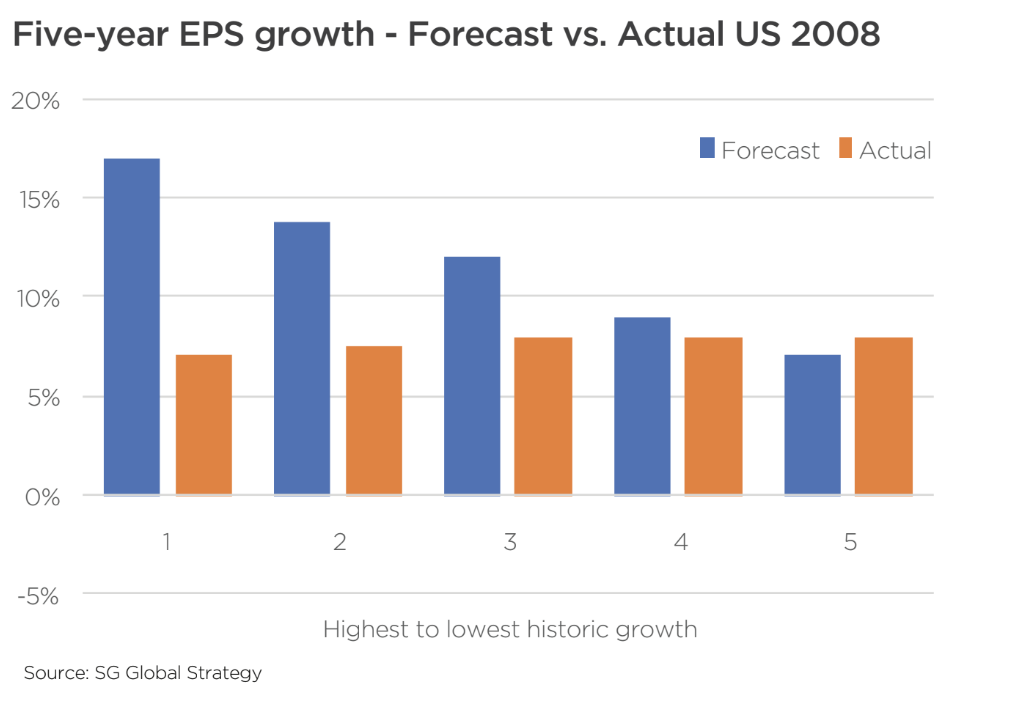
If past growth can’t quantitatively identify fast-growers, can analyst judgement do better? After all, most people would consider stock analysts to be experts in the companies they cover and financial forecasts to be central to their job. Sadly, sell-side analysts in general have no ability to distinguish fast-growers from the rest. Companies expected to grow EPS in the highest bracket generate growth that is, on average, different from those expected to grow at the slowest rate.
3. Price momentum
Some academic literature supports historic share price performance, or ‘price momentum’, as a predictor of future price performance, and of price momentum being explained by earnings momentum. We have not, however, come across any research that supports price momentum as a predictor of future superior earnings growth. It may exist; we just haven’t found it.
Summary
The notion of ‘growth companies’ and in turn ‘growth investors’ has little to support it. As much as some might like to think that businesses that will generate high rates of EPS growth in the medium-term are easily identified, the evidence demonstrates that this is not the case.
Above-average rates of achieved sales growth or EPS growth do not translate to above-average future EPS growth. Stock analysts show no ability in general to identify those businesses that will generate superior EPS growth.
Check back tomorrow for our analysis of value investing.
This article was written by Stephen Arnold, CFA, founder and Chief Investment Officer of Aoris Investment Management. Click here to download Stephen’s free Owner’s Manual.
![]()