

With the markets nearing all time highs, we’re going to investigate whether there is value amongst the ASX’s most pricey companies using the Saasy Lynch Indicator.
Peter Lynch of Fidelity’s Magellan Fund would be willing to pay high prices for companies as long as they are backed by higher growth. While he generally applied this to profitable companies, the principles of value can still be applied to pre-earning companies with high levels of revenue growth.
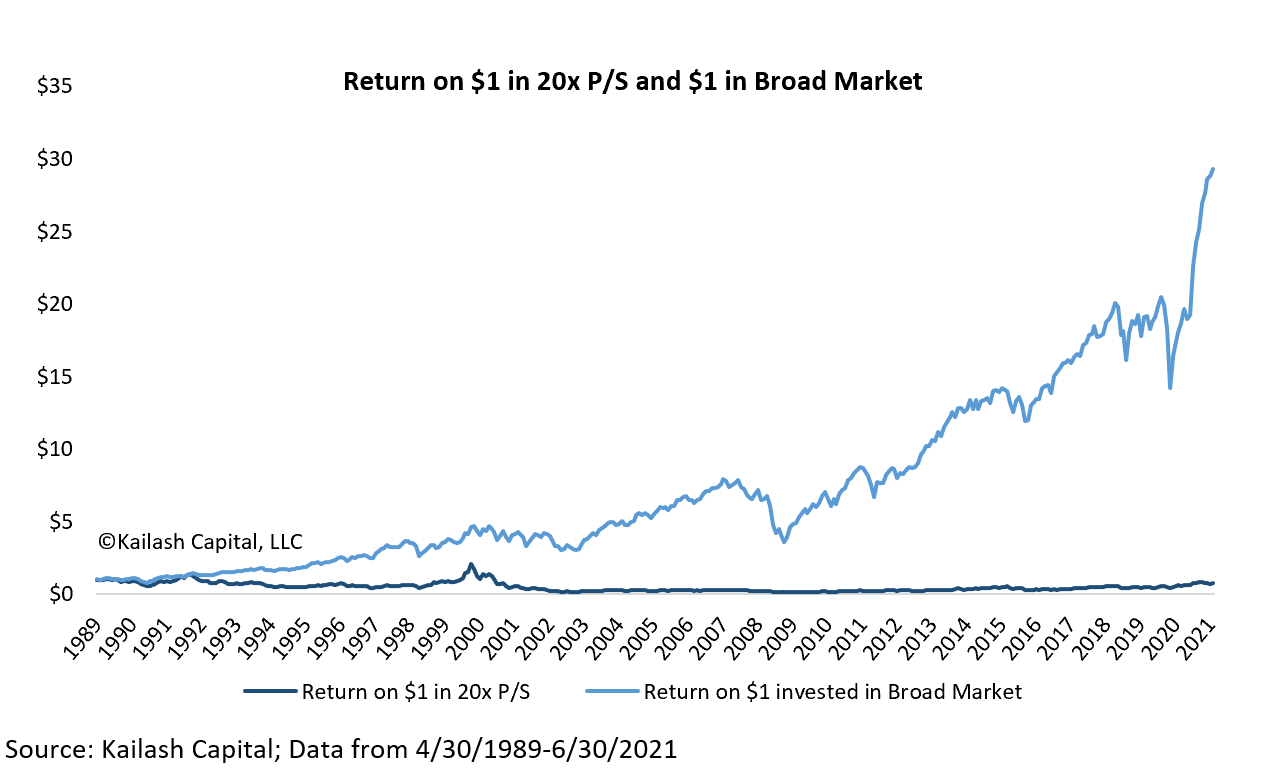
The more you pay, the lower your returns
Previously outlined in the ETFS Hydrogen ETF (ASX:HGEN) article
, research from Kailash Capital showed terrible forward returns and no margin of safety when investing in high priced companies (price to sales is greater than 20).
Below is a screen of the ASX’s largest companies with enterprise value to revenue above 20, and revenue greater than $50 million. Unsurprisingly, one notices that most of the top 20 are Software-as-a-Service (SaaS)-type companies.
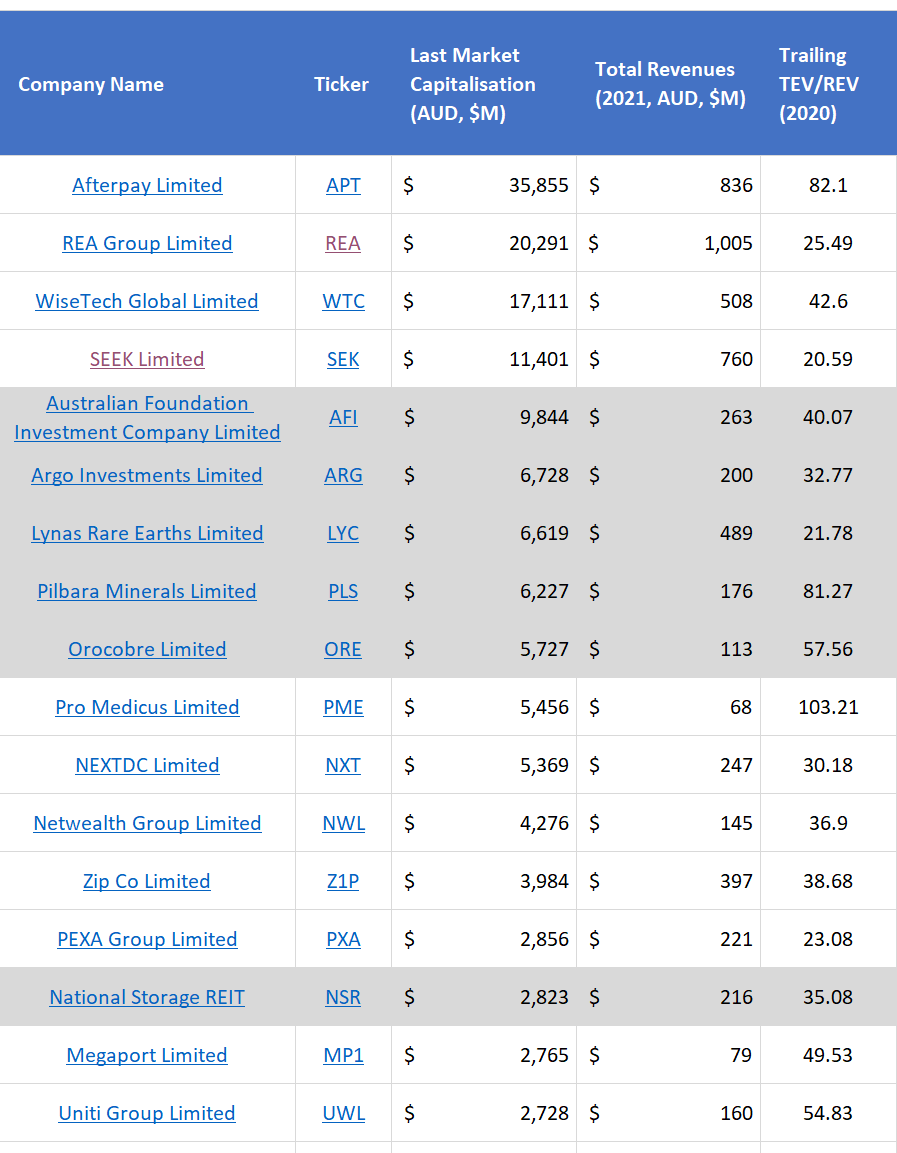
For the purpose of this analysis, I removed financials and mining. Financials don’t include the look through revenue (e.g. Argo invests in Wesfarmers and gets $1 of dividends and books it as ‘revenue’, though really that’s based on $50 of revenue in Bunnings); and miners have increasing commodity prices that aren’t booked in historical revenue figures. So the shaded rows are removed.
The Saasy Lynch Indicator
Lynch developed the PEG ratio (price to earnings, divided by the growth rate) to overcome a challenge with looking solely at PE ratios (price to earnings) by factoring in future growth. As Lynch popularized in One Up On Wall Street:
“The P/E ratio of any company that’s fairly priced will equal its growth rate…If the P/E of Coca-Cola is 15, you’d expect the company to be growing at about 15 percent a year, etc. But if the P/E ratio is less than the growth rate, you may have found yourself a bargain… On the other hand, a company with a growth rate of 6 percent a year and a P/E ratio of 12 is an unattractive prospect and headed for a comedown…In general, a P/E ratio that’s half the growth rate is very positive, and one that’s twice the growth rate is very negative.”
PEG ratio doesn’t work for SaaS companies, because they often are pre-earnings and their free cash flow is reinvested into growth and scale. So instead I’ve replaced the numerator with ‘enterprise value to revenue’, and used forecast revenue growth as the denominator. The concept remains valid, but absolute values are not comparable.
Valuing the ASX’s most expensive with the Saasy Lynch
If forecast growth rates are correct, the higher the Saasy Lynch then the lower your returns. Conversely, relatively low Saasy Lynch means the company is relatively cheaper today.
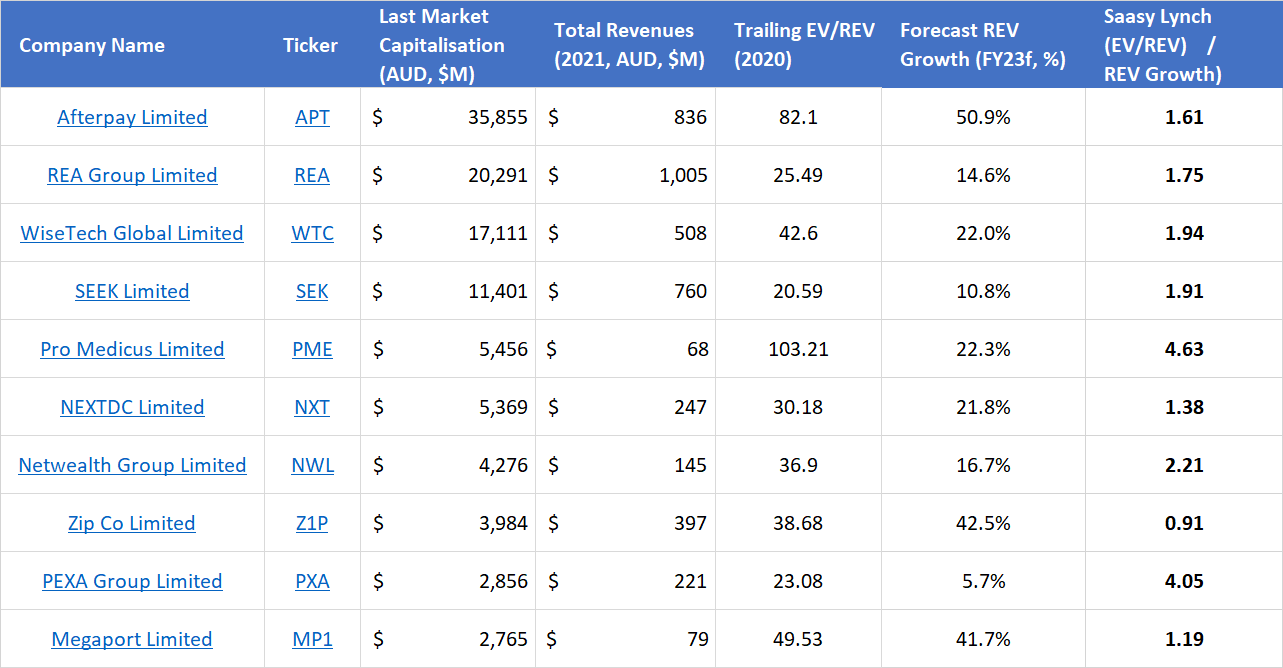
Zip (ASX: Z1P) looks relatively cheap, though there are regulatory and other issues that may explain that discrepancy. Megaport (ASX: MP1) and NextDC
(ASX: NXT) compare well, while Wisetech (ASX: WTC), REA Group (ASX: REA), Afterpay (ASX: APT) and Seek (ASX: SEK) will probably need to beat expectations. Meanwhile, the recently IPO’d Pexa Group (ASX: PXA) and hot-stock Pro Medicus (ASX: PME) would need to substantially beat consensus growth forecasts to grow into their valuations.
It’s important to note that the forecasts are based on broker consensus (all bar two had +10 brokers), and have a range of values. If you have an edge in a sector or company in forecasting expected growth rates, you may be willing to pay higher prices for better quality and more resilient businesses.
Do valuations really matter if it’s a quality growth company?
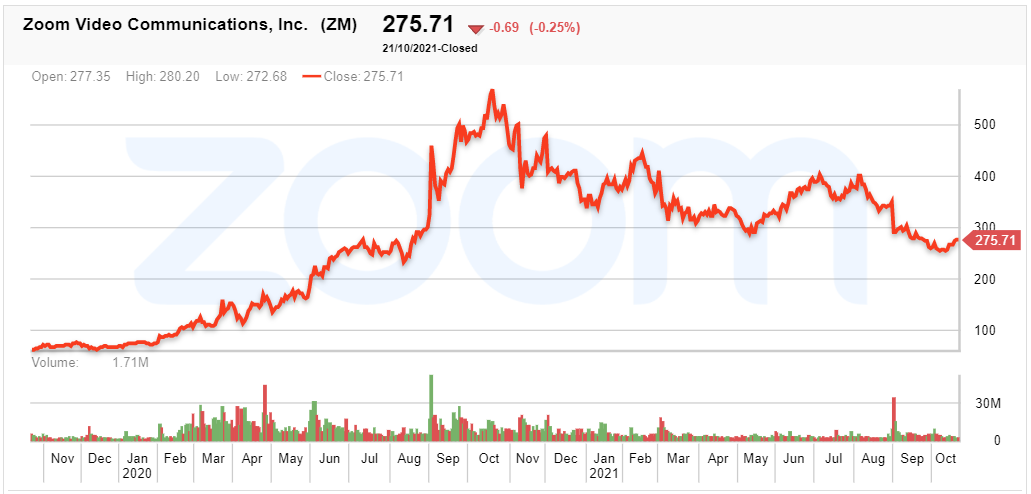
We’re all familiar with Zoom (NASDAQ: ZM), and how fantastic its product is. Revenue has quadrupled since the start of Covid-19, and ‘Zoom’ is now part of our lexicon. At its peak, the EV/REV was >140x!
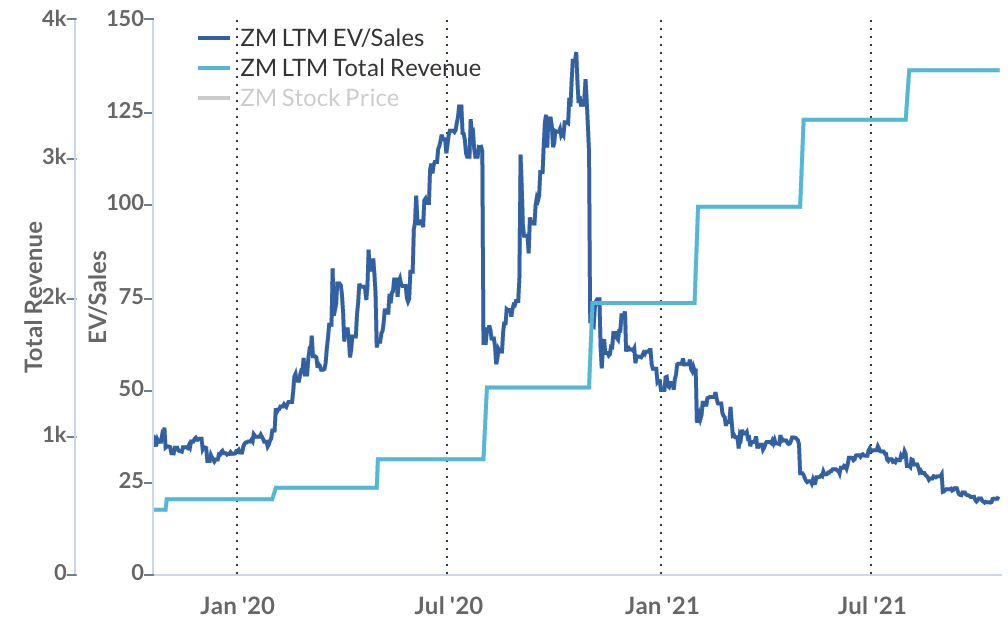
Since then the EV/REV has come down to a modest 20x. The result is a multiple contraction (1/7x) contrasted with revenue growth (4x), resulting in the share price almost halving. It can be hard to outgrow phenomenal market expectations.
ZM share price chart
Final Thoughts
Growth stocks can be important to supercharge the returns in your portfolio. But that doesn’t mean we should ignore valuations. Paying a high revenue multiple can lead to acceptable returns, if it’s combined with market-beating high growth rates.