

You probably know this but Westpac Banking Corp (ASX: WBC) shares are amongst the most traded on the ASX — together with other ‘big bank’ stocks like National Australia Bank Ltd (ASX: NAB).
ASX bank shares make up over one-third of the Aussie stock market, measured by the market cap and the All Ordinaries Index.
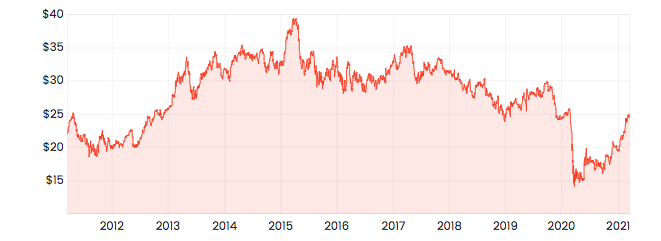
WBC share price over 10 years
A primer on PE ratios
I’m guessing you’ve heard about the PE ratio. Also known as the ‘PER’, it compares a company’s share price (P) to its most recent full-year earnings per share (E). If you bought a pizza shop for $100,000 and the shop made $10,000 of profit last year, that’s a price-earnings ratio of 10x ($100,000 / $10,000). ‘Earnings’ is just another word for profit. Therefore, the P/E is basically saying price-to-yearly-profit multiple.
The PE ratio is a very simple tool but it’s not perfect so it should only be used with other techniques (see below) to back it up. That said, one of the simple ratio strategies even professional analysts will use to value a share is to compare the company’s PE ratio with its competitors to try to determine if the share is overvalued or undervalued. It’s akin to saying: ‘if all of the other banking sector stocks are priced at a PE of X, this one should be too’. I’ll go one step further than that in this article. We’ll apply the principle of mean reversion and multiply the profits per share (E) by the sector average PE ratio (E x sector PE) to calculate what an average company would be worth.
If we take Westpac’s share price today, together with the earnings per share data from its most recent full financial year, we can calculate the company’s PE ratio to be 38.8x. That compares to the banking sector average PE of 24x. Keep in mind the profits of most Aussie banks were deeply affected by COVID last year (it also impacted dividends).
Reversing the logic here, we can take the profits per share (EPS) ($0.637) and multiply it by the ‘mean average’ multiple. This results in a ‘sector-adjusted’ share valuation of $15.54.
Dividend models: good, not great
Not long ago I did a tutorial, using Woolworths Ltd (ASX: WOW) as my example, to explain how a dividend discount model can be done easily. You can take the free valuation tutorial by going here.
A DDM or dividend discount model is quite different from ratio valuations since it makes you/us forecast cash flows into the future (it uses dividends as a proxy for ‘cash flow’). Because the banking sector has proven to be relatively stable with regards to share dividends, the DDM approach can be used. However, we would not use this model for, say, technology shares.
Basically, we need only one input into a DDM model: dividends per share. Then, we make some assumptions about the yearly growth of the dividend (e.g. 2%) and the risk level of the dividend payment (e.g. 7%). We’ve used the most recent full-year dividends (which were depressed due to COVID) then assumed the dividends remain consistent but grow slightly.
For simplicity, let’s assume last year’s dividend payments are consistent. Important warning: last year’s dividends are not always a good input to a DDM because dividends are not guaranteed since things can change quickly inside a business. So far in 2020, Australia’s Big Banks have been cutting or deferring their dividends.
To make this easy to understand, using our DDM we will assume the dividend payment grows at a consistent rate in perpetuity (i.e. forever) at a yearly rate between 2% and 3%.
Next, we have to pick a yearly ‘risk’ rate to discount the dividend payments back into today’s dollars. The higher the ‘risk’ rate, the lower the share price valuation.
We’ve used an average rate for dividend growth and a risk rate between 6% and 11%.
This simple DDM valuation of WBC shares results in a fair value of less than $6. However, using an ‘adjusted’ dividend payment of $1.07 per share (current analyst estimates from CapIQ), the valuation goes to $19.18. The valuation compares to Westpac Banking Corp’s share price of $24.73. You can see how the dividend assumptions greatly skew the valuation — so be sure to do more research before relying on this valuation model.
Your research doesn’t end here
Feel free to use these two models as the starting point for your process for analysing and valuing a bank share like WBC. However, please remember that these are just tools used by analysts and in reality, a good analyst and investor will likely conduct 100+ hours of qualitative research before diving into their spreadsheet and starting their modelling.
For example, our team spends a lot of our time looking at bank shares and writing about them, but if we were thinking about investing in a bank like Westpac today we would want to get a handle on its growth strategy, economic indicators like unemployment, and then study house prices and consumer sentiment.


