

The Openpay Group Ltd (ASX: OPY) share price hasn’t moved a lot since the release of its half-year results for HY21. It’s also moving at a slower pace than the other buy-now-pay-later (BNPL) players, why is this so?
It appears Openpay is taking a leaf from Aldi’s book in trying to be, ‘Good Different’, by being a highly differentiated player in the BNPL payment solutions market. Openpay provides flexible plans over 2-24 months and up to $20,000 with a strong focus on the following segments: automotive, healthcare, retail, home improvement, sports memberships and education.
The company is targeting older customers who are finance-savvy and use Openpay plans as a cashflow management tool. It provides services to customers and merchants in Australia, New Zealand, the UK, and entered the US market in December 2020.
A diversified portfolio of income
Openpay makes money from both merchants and customers. It receives merchant fees, which represent a percentage of the transaction value of the good or service paid by the customers using the Openpay payment platform.
Customer fees include plan management fees and, in some cases, an initial plan establishment fee and late fees.
The company does not charge interest on any of its current plans.
So, the income received from merchant fees is driven by the volume and value of transactions processed. The volume and value of transactions processed can vary greatly across different segments as depicted below.
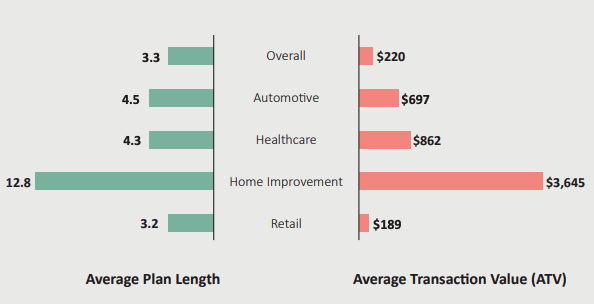
The different volumes aren’t illustrated above but you can imagine how different it is, you wouldn’t complete home renovations as frequently as you buy clothes. Even though the home renovations segment would generate a lower volume of transactions, the actual percentage of merchant fees received is higher due to the higher average transaction value.
Openpay actually derives most of its merchant fees from the automotive and healthcare sectors (80%) and retail take up 14%. This likely explains why Openpay is experiencing a slower rate of growth in revenue relative to peers like Afterpay Ltd (ASX: APT) and Zip Co Ltd
(ASX: Z1P), who are more focused on high volume sectors like retail and beauty.
Growth continues for automotive, healthcare and retail
Since Openpay doesn’t receive any interest from customers, it essentially derives income from plan management fees, as well as non-recurrent initial establishment fees and late fees. So, for Openpay to drive growth in this area, it needs to keep acquiring more customers.
In HY21, retail was still the biggest grower in terms of new customers and plans and Openpay experienced solid growth in automotive and healthcare.
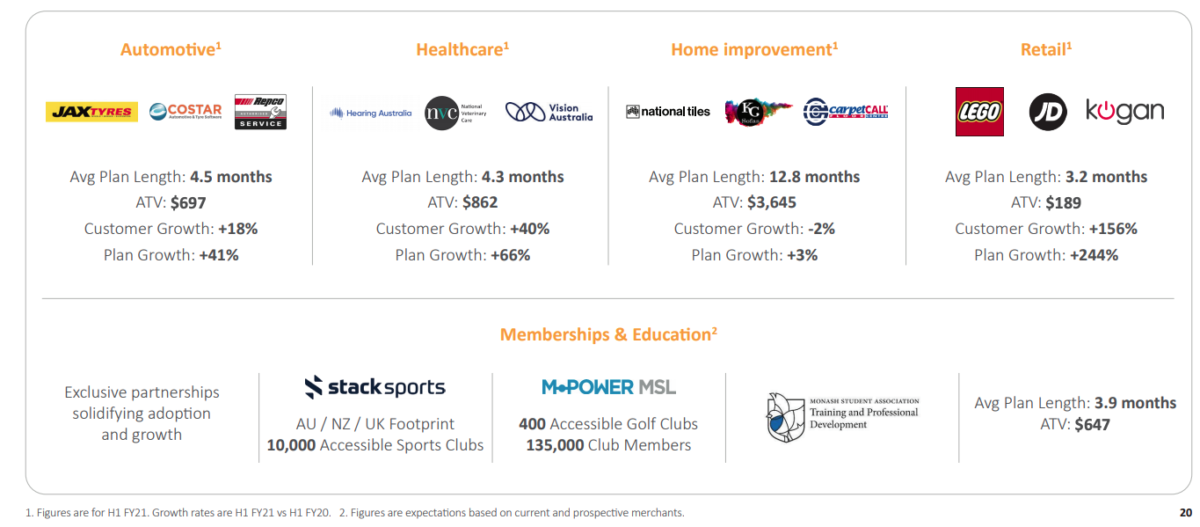
It seems like there isn’t much take-up in the home improvement vertical but the decline in this space is offset by the other segments. This is one key benefit of possessing a diversified portfolio of income.
Is it really ‘Good Different’?
I like Openpay’s diversified segment base, which will likely provide strong resilience in challenging economic conditions. Another positive is that it’s fishing in different ponds from its competitors.
Whilst it is encouraging to see that Openpay appears to be gaining more market share within its key segments in automotive and healthcare, investors should monitor operating expenses. Operating expenses rose by 60% in HY21 relative to HY20 as Openpay focuses on market penetration and scale.
I think a comparative analysis between the profitability of higher average transaction value segments (automotive and healthcare) and lower average transactions value segments (retail) is an important question to consider next. It’s essentially asking whether lower volume plus higher price or higher volume plus lower price would win i.e Ferrari versus Ford.
If you are interested in other ASX growth shares, I suggest getting a free Rask account and accessing our full stock reports. Click this link to join for free and access our analyst reports.