Even if you’re a professional investment analyst, formulating a share price forecast for a company like National Australia Bank Ltd. (ASX: NAB) is never a certainty. Nonetheless, a thorough valuation will help you understand what’s going on under the hood.
Despite share prices taking a hit in the wake of COVID-19, ASX bank shares still make up a significant proportion of the S&P/ASX 200 (INDEXASX: XJO).
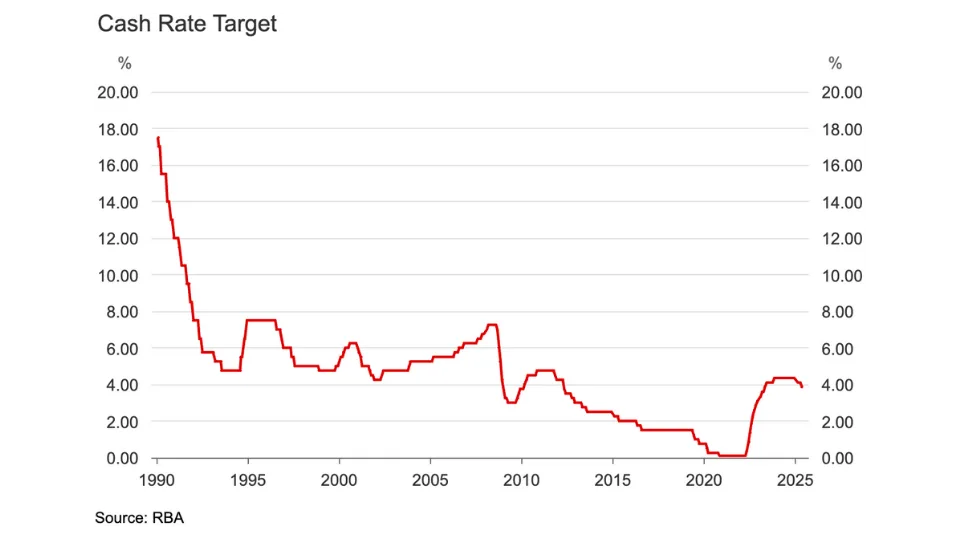
I think it’s easy to see why bank shares have been very popular since the early 1990s. When Australia began a once-in-a-generation unwinding of interest rates (from over 15%!), our population began to rise quickly and consistently, and the resources and housing booms took flight. Banks were obvious beneficiaries of these structural trends.
Fast forward to 2020, however, and things are starkly different. It’s been a big year for ASX bank shares and NAB is no exception. The NAB share price is down nearly 23% year to date, underperforming the broader benchmark index which has recorded a 10% drop. What’s more, the company’s all-important dividend was cut by 64% in April when NAB declared a 30 cent per share interim dividend.
Without further ado, here are two simple ways to value an ASX bank share like NAB.
1. Price-earnings ratio
The price-earnings (P/E) ratio compares a company’s share price (P) to its most recent full-year earnings per share (E). Remember, ‘earnings’ is just another word for profit. That means the P/E ratio is simply comparing share price to the most yearly profit of the company.
Some investors will try to tell you that ‘the lower P/E ratio is better’ because it means the share price is ‘low’ relative to the profits produced by the company. However, sometimes shares are cheap for a reason!
What’s more, some extremely successful companies have gone for many years (a decade or more) and never reported an accounting profit — so the P/E ratio wouldn’t have worked.
A more methodical way to use the P/E ratio (for a profitable business) is by comparing it to the sector average. For example, taking the P/E ratio of NAB shares and seeing how it stacks up against its big bank peers. Is it higher or lower? Does it deserve to be more expensive or cheaper?
Another way to use this ratio is by taking the earnings per share of the company you’re valuing and multiplying that number by a P/E multiple you believe is appropriate. For example, if a company’s profit per share (E) was $5 and you believe the share is ‘worth at least 10x its profit’ it would have a valuation (according to you) of $5 x 10 = $50 per share.
An important caveat here, especially in the current environment, is that a trailing P/E ratio uses historical earnings – i.e. profits reported over the last 12 months. It goes without saying that bank profits are going to be hit hard by COVID-19, so trailing P/E ratios should be used with caution (or even better, avoided in favour of forward P/E ratios).
2. Dividend discount model
A dividend discount model (DDM) is a more robust way of valuing companies in the banking sector. A DDM is one of the oldest valuation models used on Wall Street and even here in Australia.
It uses the most recent full-year dividends (e.g. from 2019/2020) or forecast dividends for next year and then assumes a growth rate (or lack thereof) for dividends for the forecast period (e.g. 5 years or forever).
Of course, the same caveat applies here in that trailing dividends won’t be replicated in the near-term. While NAB cut its interim dividend back in April, other big banks like Australia and New Zealand Banking Group (ASX: ANZ) and Westpac Banking Corp (ASX: WBC) ‘deferred’ their dividend decisions to later this year.
So, using forecast dividends in your model is necessary to account for these upcoming dividend cuts.
To understand how to value an ASX dividend share, like a bank or REIT, using the dividend discount model, consider watching this tutorial video from the analyst team at Rask Australia:
You can subscribe to the Rask Australia YouTube channel and receive the latest (and free) value investing videos by clicking here.
Putting it all together
I think it goes without saying that these two models are only the starting point of the process for analysing and valuing a bank share like NAB.
For starters, I’d comb through the financial statements for risks. Areas to focus on include the growth of loans (balance sheet), provisions for bad loans (income statement), rules for assessing bad loans (accounting notes) and sources of capital (wholesale debt markets or customer deposit).
On the latter, take note of how much it costs NAB to get capital into its business to lend out to customers. Keep in mind that overseas debt markets are typically riskier than customer deposits due to exchange rates, regulation and the fickle nature of investment markets.
Next, I’d also take a close look at economic indicators like unemployment, house prices and consumer sentiment. Where are they headed?
Finally, it’s always important to make an assessment of the management team. For example, when we pulled data on NAB’s culture we found that it wasn’t a perfect 5/5. No company has a perfect culture, of course. However, culture is one thing we think about a lot when analysing companies to buy and hold over the very long-term (10+ years).
[ls_content_block id=”14946″ para=”paragraphs”]
Disclosure: At the time of writing, Cathryn has no financial interest in any of the companies mentioned.