
Following the excellent analysis of how volatile March 2020 was for the Dow Jones Industrial Average by Nick Maggiulli from Of Dollars & Data, I decided to take Nick’s methodology and see what it would reveal about the S&P/ASX Emerging Companies Index (ASX: XEC) for March 2020.
The methodology followed allows us to look at the index’s volatility by using the cumulative absolute percentage change in the S&P/ASX Emerging Companies Index daily returns when grouped into various time periods. Thus, if the index returned +1% on day 1, +3% on day 2, – 1% on day 3, then over the three days the index has travelled 5% in absolute terms. By taking these absolute daily index moves both backwards and forwards it gives us the cumulative absolute percentage change or distance travelled by the index for a period.
I decided to look at the cumulative absolute percentage change of all the daily index returns over the course of a calendar year, quarter and month to see what it would reveal about ASX microcap volatility over recent times and how this compared to historical periods. The S&P/ASX Emerging Companies Index goes back to Jan 1, 2004, so I have just over sixteen years of returns and 4,149 individual daily return observations in my analysis.
Watch it now: Coffee Microcaps Virtual Conference April 2020
Yearly (Chart 1)
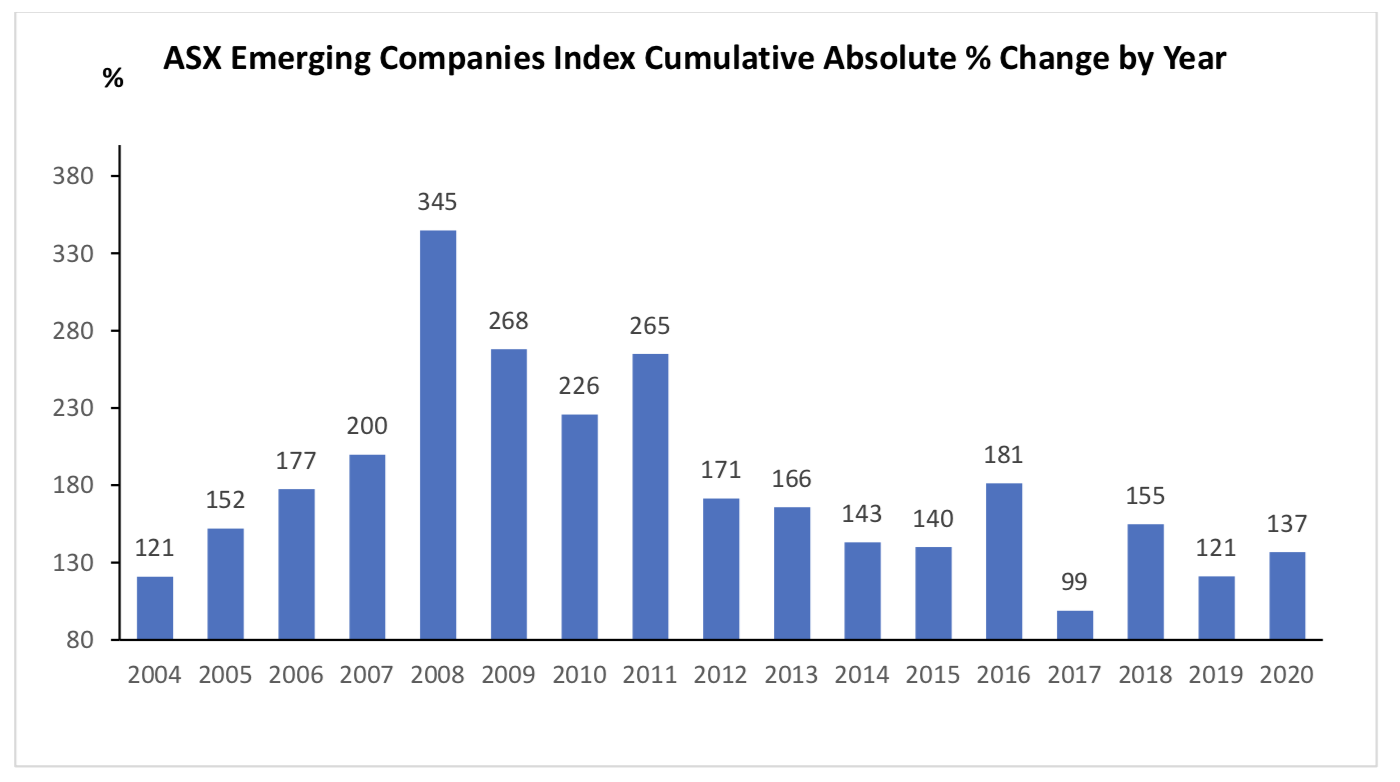
The first thing we can see is that the distance travelled for Q120 has already outpaced the entire calendar year of 2019! The mean and median distance travelled in a normal year are 180.4% and 165.7% respectively. Thus, the index has already covered 76% of the mean and 82% of the median distance travelled by the index in a typical year. If we forecast out based on 75% of the mean and median distance travelled by the index in an normal year and add this to the 137% already travelled in Q120 we arrive at forecasted distance travelled of 272% & 261% respectively for calendar year 2020, putting us firmly around GFC levels.
Quarterly (Chart 2)
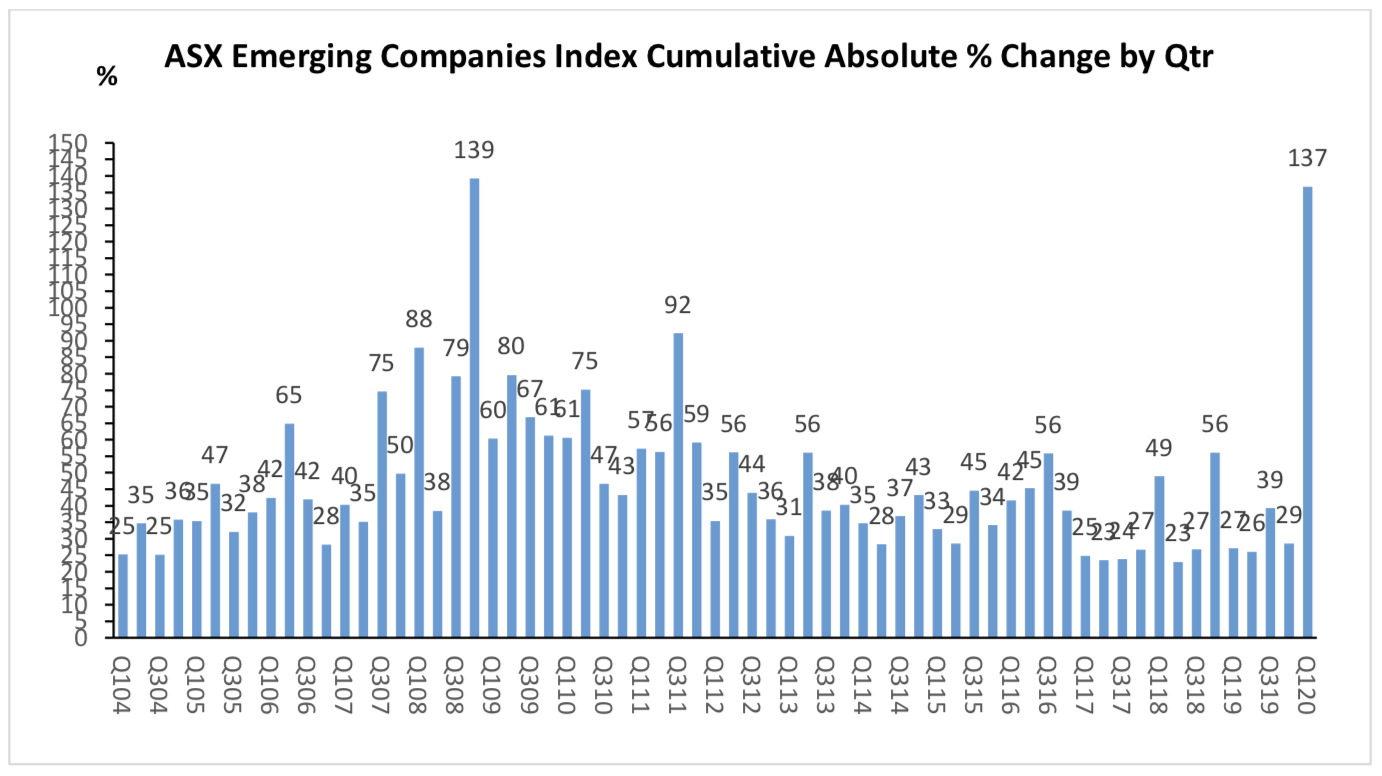
Secondly, when we drill down into quarterly distance travelled, we can immediately see that Q120 was a shade behind the 139% recorded in Q308, during the height of the GFC. The distance travelled of 137% in March 2020 is far above the mean and median quarterly distance travelled of 47.2% and 40.3% respectively in a normal quarter. Furthermore, I note that Q120 and Q308 are the only two quarters where the distance travelled reached triple digits. Just two quarters out of a sample size of sixty five quarters tells us that this most recent quarter was indeed exceptional even if it missed out being a record-breaking quarter by a whisker.
Monthly (Chart 3)
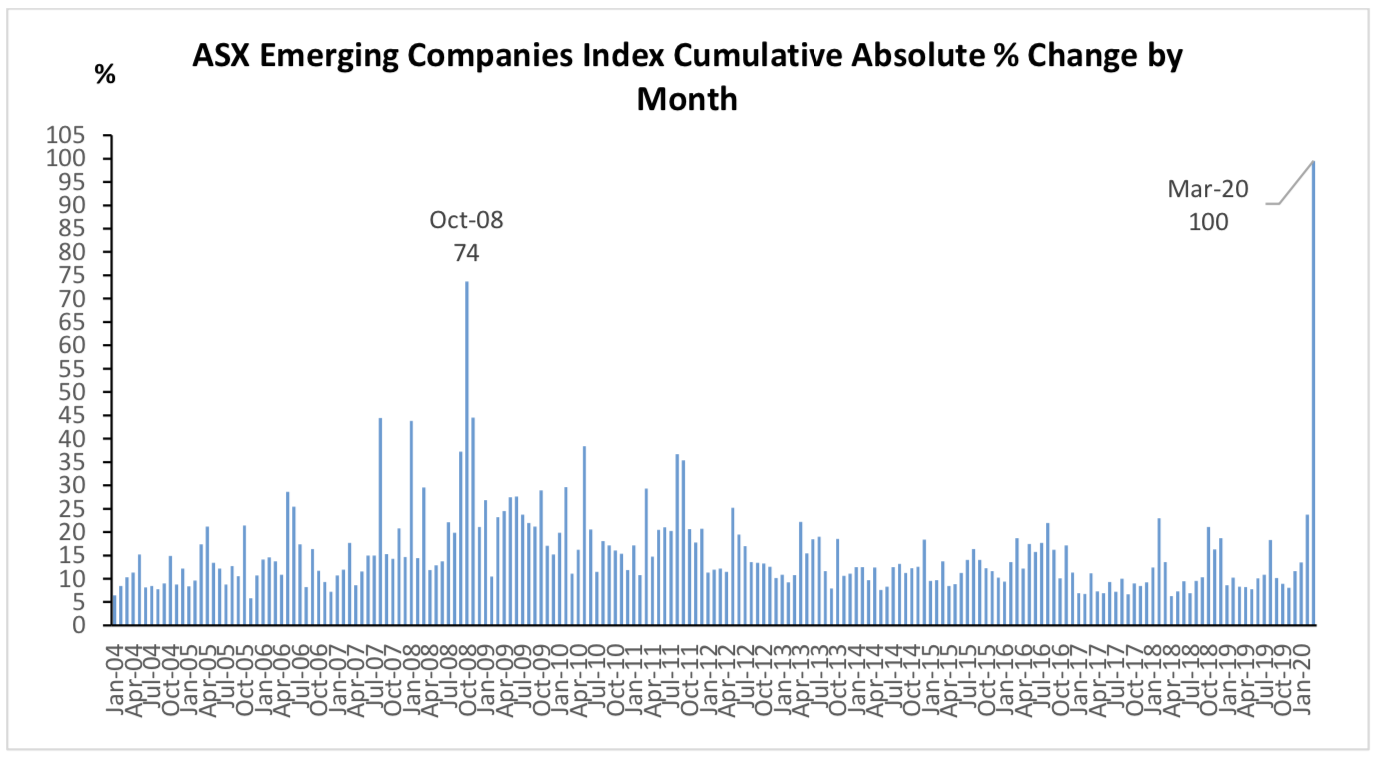
Thirdly, as can be easily seen from chart three above the monthly distance travelled in March 2020 was a record-breaker, and by some distance! 99.54% to be precise (but I rounded up to 100 for the chart to give it some added emphasis).
This result is way above the next closet month of October 2008, which recorded a distance travelled of 73.68%. March 2020 is 35.1% ahead of next the closest observation. If you thought March 2020 was a volatile month for ASX Microcaps it was. March 2020 was the most volatile month in the last 16.25 years/195 months at least, and way, way, ahead of any month seen during the GFC. For some additional context, the monthly mean and median distances travelled are 15.73% and 12.75% respectively. In terms of a standard bell curve distribution, we are well out on the tail end in terms of distance travelled in March 2020.
Outside of the volatility experienced intra month for March 2020, the absolute price return for the S&P/ASX Emerging Companies Index was -31.05% also a record in its own right. The March 2020 result surpassed the -28.55% absolute price return experienced by the index in October 2008.
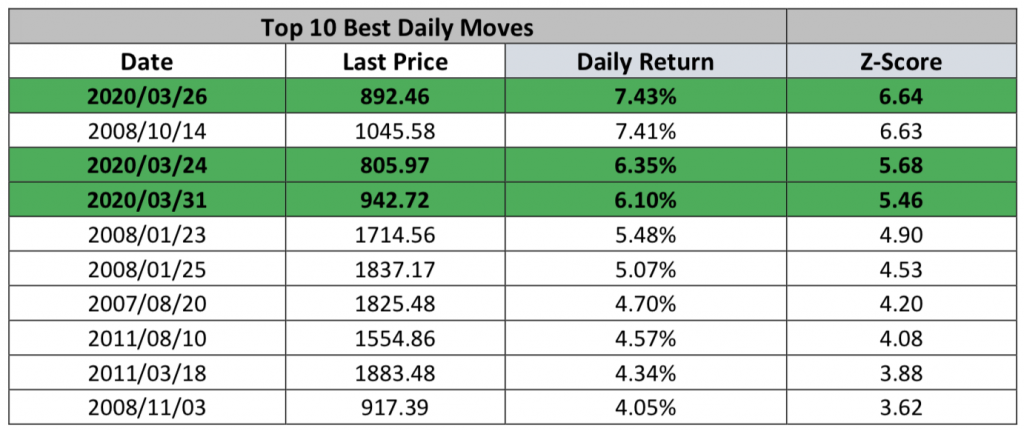
Daily
I didn’t produce a daily chart as it would have been impossible to visually make sense of it given the high number of observations. However, I did manage to pull some interesting points of the data.
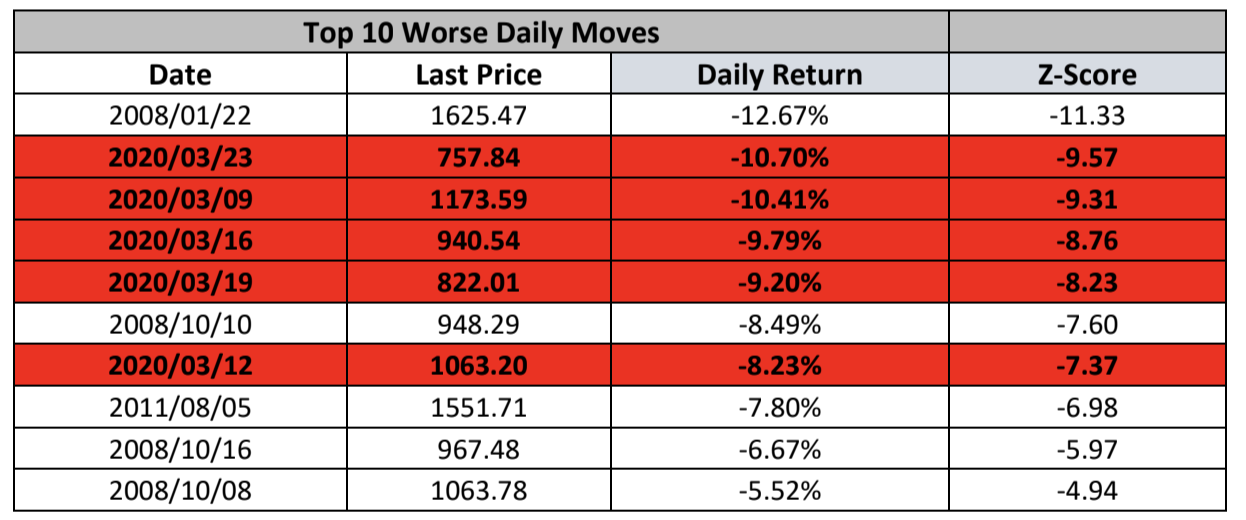
The most striking thing about the above table is that five or 50% of the ten worst days for the S&P/ASX Emerging Companies Index came in March 2020 alone! Keep in mind these five days are drawn out of a total sample size of 4,149 daily returns and were all in March 2020. Indeed, to underscore the size of the moves and volatility seen in March 2020 if we divide the distance travelled for the month of 99.54% by the 22 trading days in March 2020 you get an average distance travelled in March 2020 of 4.52%.
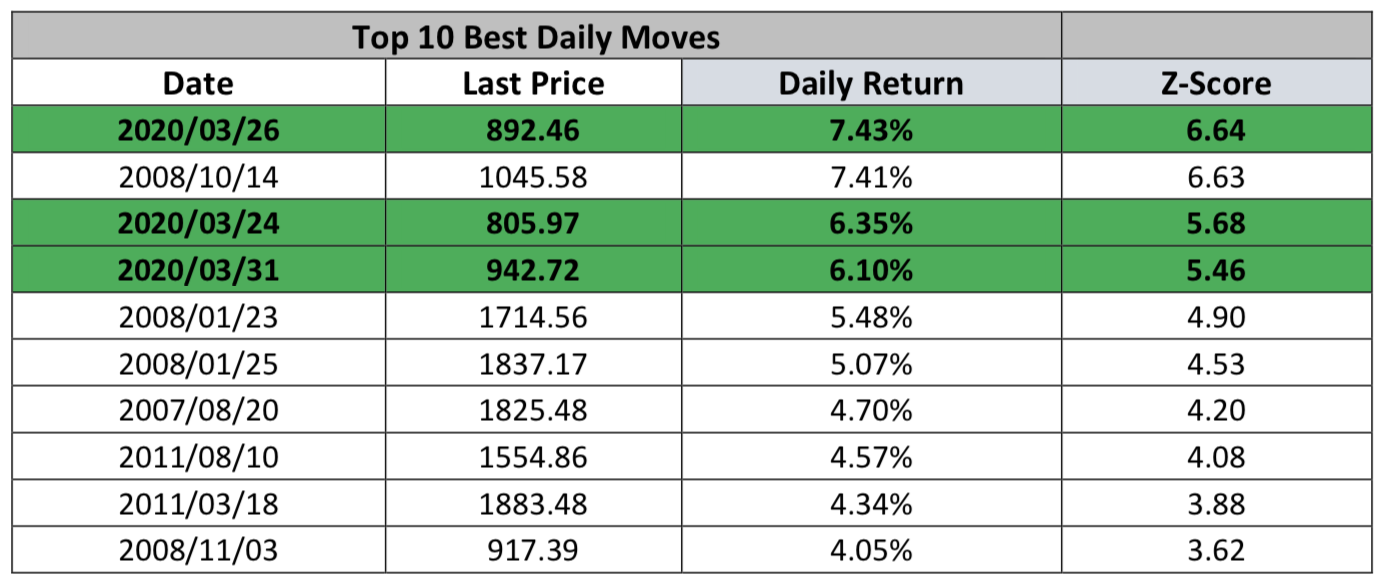
Conversely, the above table highlights the equally astonishing fact that three of the best daily returns for the S&P/ASX Emerging Companies Index happened in March 2020. Amazingly, the single best daily return for the index ever at +7.43% was recorded on March 26, 2020. This record positive daily return in a month when the index itself was down by a record 31.05% for the month. Volatility and whipsaw markets anyone?
The Z-Score (or standard score) is used in statistics to determine a value’s relationship to the mean of a set of numbers. The Z-Score is measured in terms of standard deviations from the mean. If a Z-score is 0, it indicates that the value is identical to the mean. For example, the mean is two, and the value is also two; thus, the Z-Score is 0. I won’t get into the nitty-gritty of the calculation here but suffice to say a Z-Score of +2.0/-2.0 (i.e. two standard deviations above/below the mean) would indicate a value well outside of the norm. Z-Scores of +/-6 and above were recorded on multiple March daily positive and negative returns in the preceding daily returns tables. These Z-Scores give you some additional indication of just how far away from normality these moves were compared to the general daily returns ASX microcap investors have experienced in the last sixteen odd years.
International Comparisons
Now, most people will say yes, but equity markets were terrible in March 2020 globally as everything got smashed, so the ASX Microcap market was no different. Looking at the local price returns of some other microcap indexes, we observe that Australian microcap investors probably felt more pain than most.
| Index | Market | Mar 20 Performance |
| MSCI World Micro Cap | Global | -19.0% |
| S&P/TSX Venture Composite | CAD | -21.5% |
| The Dow Jones U.S. Micro-Cap Total Stock Market | USA | -22.7% |
| MSCI USA Micro Cap | USA | -23.8% |
| LD Micro | USA | -24.4% |
| Numis Smaller Companies ex Investment Trusts | UK | -26.3% |
| S&P/ASX Emerging Companies | AUS | -31.1% |
Conclusion
So, what does all this suggest for ASX Microcap investors? I would proffer that it’s time to cast the research net far and wide as valuations of ASX Microcap stocks may have become dislocated from the underlying fundamentals and stories in certain stocks. Two stocks to cast your research and due diligence net over would be MedAdvisor Limited (ASX: MDR) and Kip McGrath Education Centres Limited (ASX: KME).
The baby has been thrown out with the bathwater, and now it is time to find the baby.
The information on this website is general financial advice only. That means, the advice does not take into account your objectives, financial situation or needs. Because of that, you should consider if the advice is appropriate to you and your needs, before acting on the information. In addition, you should obtain and read the product disclosure statement (PDS) before making a decision to acquire a financial product. If you don’t know what your needs are, you should consult a trusted and licensed financial adviser who can provide you with personal financial product advice. Please read our Terms & Conditions and Financial Services Guide before using this website.