
The silver lining following the selloff in the Westpac Banking Corp (ASX: WBC) share price is its higher trailing dividend yield. With so much noise surrounding the banking sector, let’s take a look at some key dividend metrics.
About Westpac
Westpac Banking Corporation, more commonly known as Westpac, is one of Australia’s ‘Big Four’ banks and a financial-services provider headquartered in Sydney. It is one of Australia’s largest lenders to homeowners, investors, individuals (via credit cards and personal loans) and business.
2 Key Dividend Metrics
Obviously, when most financial analysts or the news quotes a dividend yield, they’re talking about the historical dividend payments. That is, the dividends paid in the last 12 months divided by the current share price.
The problem with using historical figures is that the future won’t look the same. As Warren Buffett said, if it were that easy librarians would be the best investors.
Therefore, when you’re assessing dividends per share, there are at least two metrics you can use to get a rough idea of what the future might look like:
- Return on equity – the is a key measure of bank profits. ROE measures the amount of profit the company makes against the shareholder ‘equity’ on the balance sheet. This is important because dividends are paid out of profit. Higher ROE is better. Finding a company that goes from a low ROE to a high ROE can be even better.
- Payout ratio – this measures the amount of dividends paid as a percentage of yearly profit. Obviously, if the bank is paying more profits as dividends it leaves less for growth and investment.
The section below compares Westpac to NAB (ASX: NAB), ANZ Banking Group (ASX: ANZ) and Commonwealth Bank (ASX: CBA) to get a better sense of the sector.
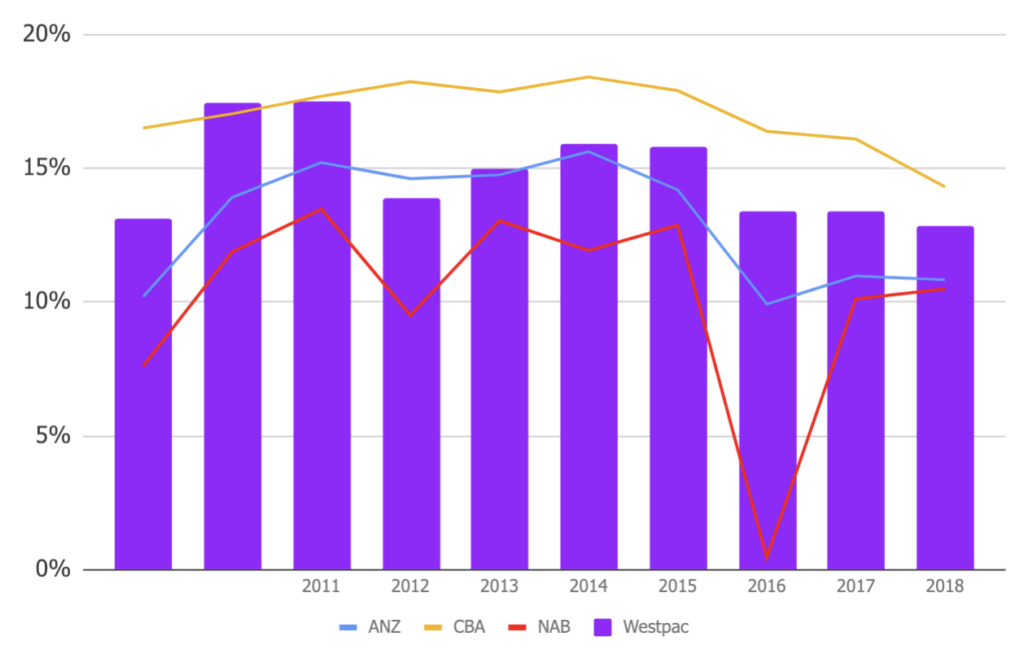
ROE

From the above, we see that Westpac’s Return on Equity has been falling in recent years. It wasn’t so long ago the bank had a target ROE of 15%. Clearly, it hasn’t achieved that. It seems low-interest rates and intense competition have hampered the bank’s ability to achieve its target.
The big issue with a falling ROE is it signals falling profitability. As I showed in this article, How I Analyse ASX Bank Shares, the banks are struggling to grow their revenue line, so cutting costs might be the only way to boost the ROE ratio.
Payout Ratios
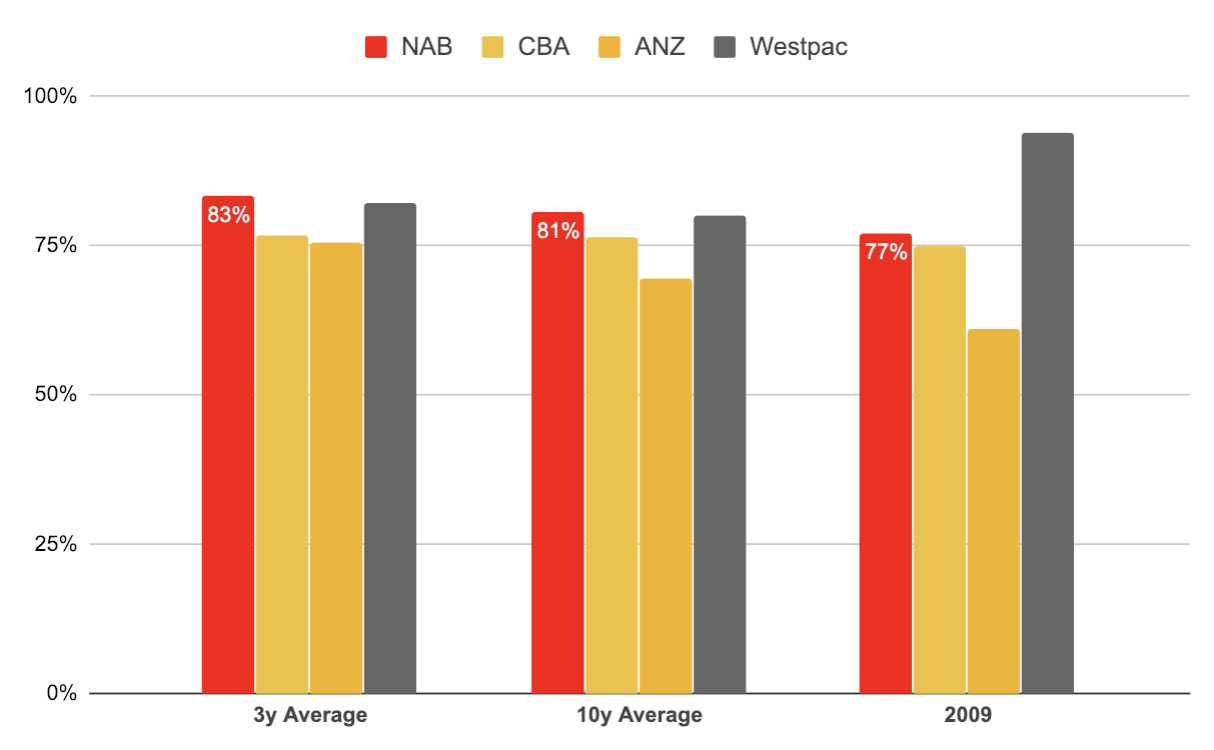
As we can see in the chart above, the amount of profit being paid back to shareholders as dividends has remained consistently high since the GFC of 2008/2009. National Australia Bank and Westpac have payout ratios much higher than ANZ and CBA.
To me this suggests that the dividends from CBA or ANZ may be more sustainable. However, there is so much more to an analysis of bank profits than this one ratio. A prudent investor would adjust their forecasts to reflect that house prices are unlikely to rebound anytime soon.
Is Westpac A Buy For Dividend Income?
As I showed in this article, 3 Reasons To Consider Selling Westpac, a good price to pay for Westpac shares is probably below $25 per share, based on its dividends per share. For a more thorough look at its valuation and, potentially, what to look for before buying, read that article.
While the 7% dividend income looks great, I’m inclined to either wait for a better buying opportunity or — if I really wanted dividend income — consider buying a diversified, low-cost Exchange Traded Fund (ETF).
[ls_content_block id=”14948″ para=”paragraphs”]


