

ASX bank shares are a staple in Aussie share portfolios, and it’s easy to see why.
Indeed, while it’s been a bumpy year for the likes of Commonwealth Bank of Australia (ASX: CBA), National Australia Bank Ltd. (ASX: NAB), Australia and New Zealand Banking Group (ASX: ANZ) and Westpac Banking Corp (ASX: WBC) it’s easy to see why investors like them…
And now, the silver lining for investors is that shares in each bank offer dividend yields in excess of 5% fully franked.
In this article, I’ll take you through some quick and easy ways to analyse bank shares and what to look for. If you’re seeking for a more in-depth analysis, see the links below.
First up, let’s look at how a bank makes money…
Loans are the primary channel for banks to make a profit. While an outstanding loan might seem like a bad thing to you and me, a bigger loan is actually an ‘asset’ for a bank.
There are two simple but important things to consider:
- The amount of the loans outstanding
- The profitability of those loans
Total Loans
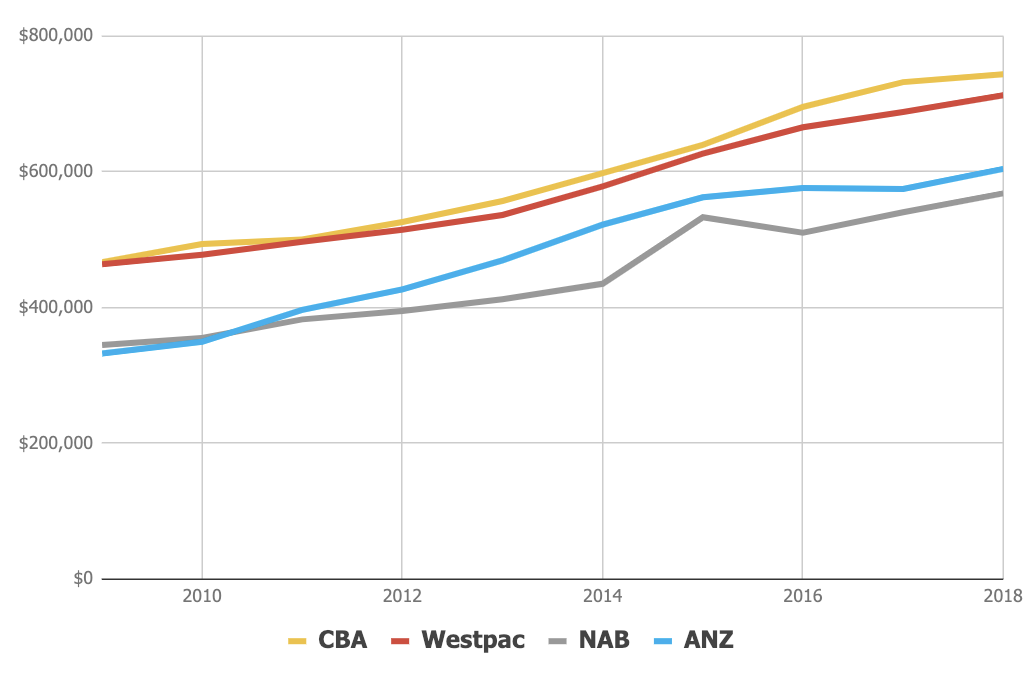
As can be seen above, each of the major banks has increased lending since the GFC of 2008/2009, which is unsurprising for a few reasons.
Rising house prices are a big factor driving the amount of total lending higher. Rising house prices mean bigger loans, more speculation, more buying and selling, more credit and — we hope — more wealth in the form of equity. Rising house prices can also make loan-to-value ratios appear prudent.
One final note from the chart above is that the rates of change are important. ANZ has grown its loan portfolio 82% over the decade. Meanwhile, NAB’s total loans have grown in value by 65%, CBA’s by 59% and Westpac’s by 54%.
Lending Profits Rising
The rise in lending has lead to an increase in the amount of ‘net interest income’, which can be found on the Income Statement of a bank.
The net interest income shows the amount of income the bank makes from lending money after it pays interest to deposit holders and wholesale investors.
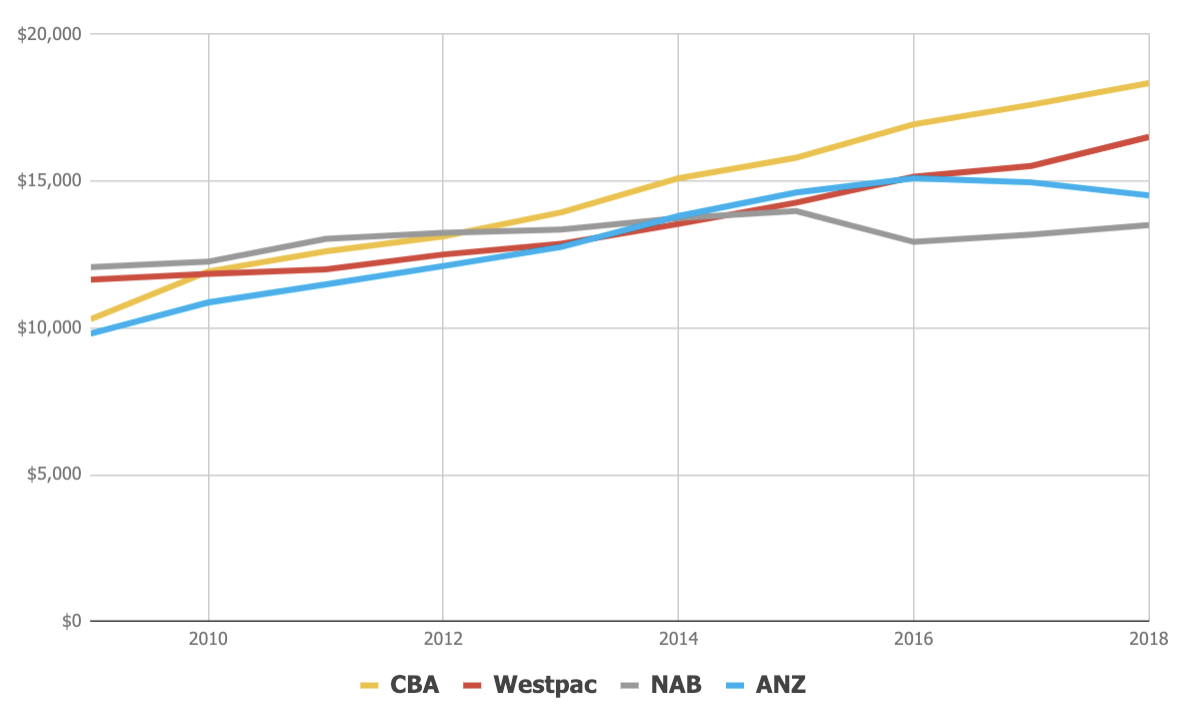
As can be seen, unsurprisingly each of the banks has increased their lending profit over time. Let’s keep in mind, however, growth for growth’s sake can be a bad thing.
We’ll now look at the ratio of net interest income to loans outstanding…
Profitability of Lending
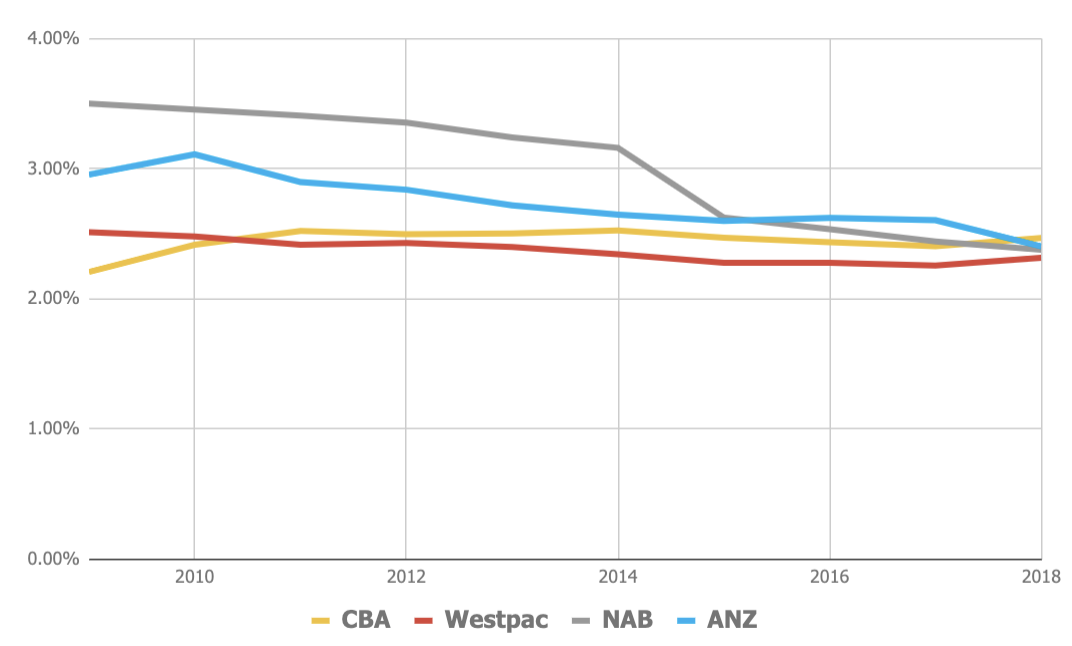
Please note that I’ve used a back-of-the-envelope calculation to arrive at the net interest margin. Often called the ‘NIM’, this is perhaps the most important ratio to use when comparing bank lending profitability.
Probably the most important development in Australian bank lending over the past decade is the narrowing of net interest margin — the amount of interest the banks earn on a loan.
In the past, I may have attributed this narrowing to low-interest rates. Presumably, lower interest rates make changes in lending more pronounced (meaning it’s harder for a bank to scratch out a profit).
However, overseas, where interest rates are even lower than here at home, European banks like ING Groep NV
(NYSE: ING) and US banks such as Wells Fargo (NYSE: WFC) have been able to maintain their margins.
Competition for loans from other lenders like ING, Macquarie Group Ltd (ASX: MQG), Bendigo Bank (ASX: BEN), Suncorp (ASX: SUN) and BOQ (ASX: BOQ) might explain the pressure on margins. So too might the Bank Levy, comparison websites, etc.
Non Lending Income V. Lending Income
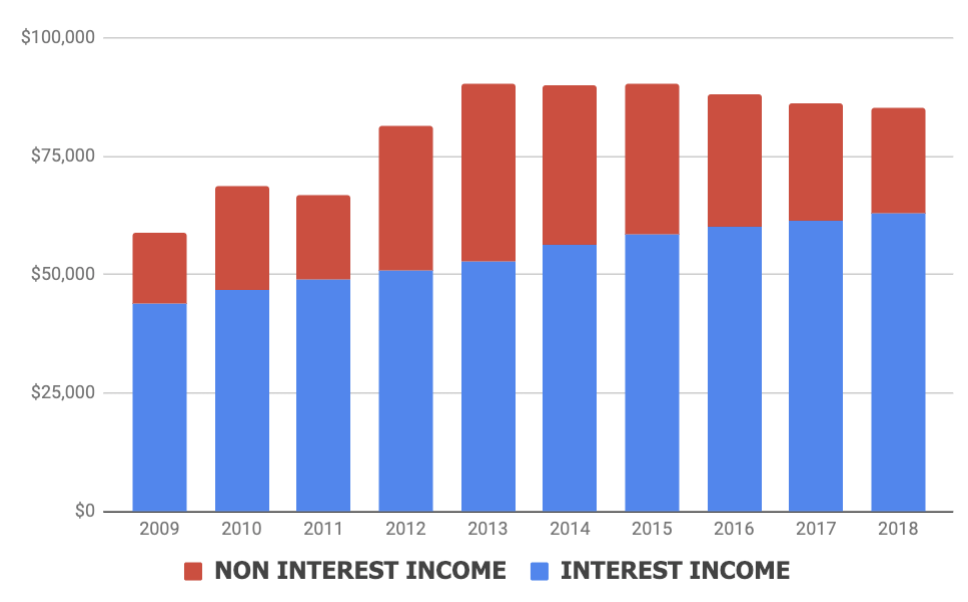
Banks also make money outside of lending.
For example, they also have wealth management, financial planning and insurance businesses. Even though the banks seem keen to get rid of these assets, these income streams should be considered separately.
As can be seen above, the proportion of profit from non-lending income has slowed dramatically since 2013. Given what we’ve seen in the Royal Commission don’t be surprised to see this continue to fall.
Summary
I hope this (very) brief discussion provides some insight into how you might go about analysing an ASX bank share.
Obviously, there is a LOT more to it than this analysis — other things to consider include interest rates, household and business indebtedness, GDP, lending quality (bad debts), the proportion of business lending to residential, cost of wholesale versus deposit funding, leverage, bad management, regulatory risks and much more.
Finally, consider the alternatives. I recently compared Commbank to ING, demonstrated the valuation of Commbank through time, questioned if NAB shares were worth $29 per share and did a very quick valuation of Westpac shares.
Do I own bank shares?
If that all sounds like too much probably all you need to know is I don’t own shares in any Aussie bank. If you want the names of three dividend + growth shares I would own before the banks, keep reading…
[ls_content_block id=”14945″ para=”paragraphs”]


