

CSL Limited (ASX: CSL) is now the 5th
largest Biotechnology company in the world according to their ASX Announcement released yesterday. It is also the 4th Largest company in Australia by market capitalization with only Commonwealth Bank (ASX: CBA), BHP Group (ASX: BHP) and Westpac Banking Corp (ASX: WBC) ahead in this regard.
CSL is focused on the development and sale of life-saving products. The majority of CSL’s revenue is generated from the sale of blood-derived products that treat rare and serious diseases. The company is also a major player in the influenza vaccination market since acquiring Seqirus in 2015.
CSL’s Story So Far
CSL has performed phenomenally since listing in 1994 at just $2.30 — its current price is $196. If only we had a time machine!
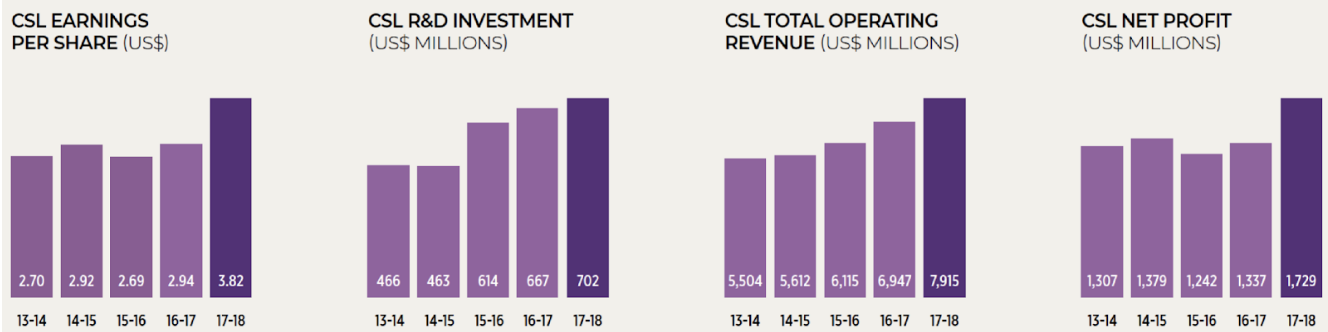
With more products and more customers, solid financial growth has been achieved by CSL over the last five 5 years, as reflected graphically below. CSL has achieved compound annual growth rates (CAGR) in revenue of 7.54%, net profit of 5.76% and profit/Earnings Per Share (EPS) of 7.19%.
Valuation
According to Reuters, CSL trades on a price-earnings (PE) multiple of 35.8x (click here to learn what the PE ratio means). CSL’s highest PE ratio over the last five years was 36.2x, reached in September last year, while the lowest PE ratio in this time period was 22.8x. Even the lowest PE ratio is “high” compared to the average share included in the S&P/ASX 200 (INDEXASX: XJO) (^AXJO), however, CSL is no average company!
As we recently analysed, CSL reported a step-up in revenue, net profit and EPS growth in the 2017/18 financial year. Growth achieved in revenue, net profit and profit/earnings per share was 13.9%, 29.3% and 29.9%, respectively.
The trend in revenue growth has been more stable when compared to that of Net Profit and EPS. Further, the five-year CAGR in revenue of 7.5% and profit/earnings per share of 7.2% has been remarkably similar.
I will, therefore, assume the 2018 revenue growth rate equals the profit/earnings per share growth rate over the next five years.
Assuming profit/earnings per share continues to compound at 13.9% over the next five years, 2023 profit/earnings per share in U.S dollar terms might be around $7.33. Converting to AUD at the current exchange rate we arrive at 2023 profit/earnings per share of $10.19.
A reasonable target PE ratio for CSL may be 29x its profit per share, which is the midpoint between the five-year highest and lowest PE ratio for CSL. If we apply a PE of 29x to estimated 2023 profit/earnings per share we arrive at a rough 2023 share valuation of $296.
Is CSL Worth The Risk?
My straightforward valuation implies an upside of about 50% on the current share price or a return of about 10% a year compounded over the next four years.
Given the risks associated with the business and forecasting, I believe an estimated 10% annualised return is too low. But CSL is evidently an excellent business. Therefore, it is a company worthy of a spot on your watchlist in 2019.
[ls_content_block id=”14945″ para=”paragraphs”]
Disclosure: At the time of publishing, William Donnan does not own shares of CSL.


