

The Australian Banks like Commonwealth Bank of Australia (ASX: CBA) have been extremely strong performers in the Australian stock market for the last 25 years, driven by robust earnings growth, increasing dividends and from operating in a monopolistic environment.
Despite the occasional and often dubious forays into foreign markets, most of the Big 4 can attribute their success to falling interest rates and the resulting great environment for Australian property.
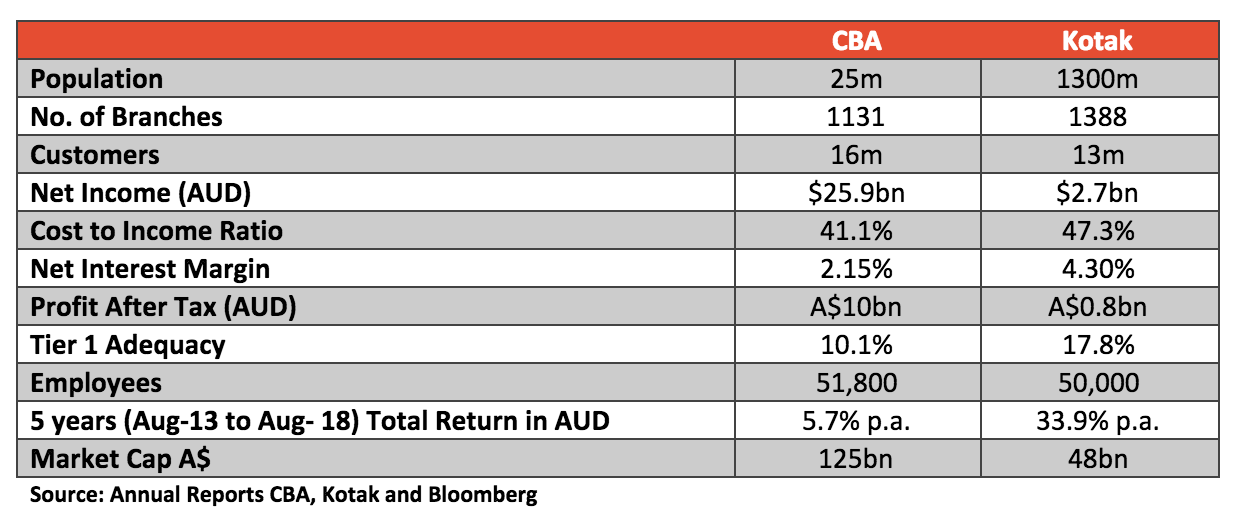
A key driver of a bank’s profitability is its customer base, market opportunity and share, and its cost-to-income ratio. Commonwealth Bank (CBA), Australia’s largest bank, is home to 16.6m customers and 51,000 employees across 11 countries. In FY18 CBA earned $26bn in income and a profit of $10.0bn, with 75% paid to shareholders in dividends.
Investors have largely received dividends as their source of return over the past 5 years. The high payout ratio reflects a lack of opportunities to grow profits above their natural or organic trajectory. CBA’s share price has moved from $72.54 on August 30th, 2013 to $70.89 by August 24th, 2018.
Time To Look Abroad?
Let’s compare the CBA to one of India’s leading private banks in Kotak Mahindra Bank Ltd (NSE: KOTAKBANK), which received its banking license in 2003. Kotak, a much younger organisation, has increased its customer base from 8m in March 2017 to 13m by May 2018, driven largely by the Bank’s new 811 account.
Due to the demonetisation reform (of the Modi Government in 2016), customers deposited their cash balances into bank accounts to cleanse the system from the cash or “black economy”. The 811 account is a full-service digital bank account with the convenience of an app. The accounts link to your national ID card and pays up to 6% interest! 90% of customers opening these accounts are aged 18-40, with accounts being opened across all 24 hours of the day.
Kotak had a net income of A$2.7bn in its last financial year.
Some forecasts suggest sustainable growth in the financial services space of up to 2x India’s nominal GDP growth (that is, above 15% per year.)
Table 1: Comparative Statistics CBA v Kotak
The chart below illustrates the divergence between the share prices of Kotak Mahindra Bank and Commonwealth Bank. As we know, CBA’s share price has not stood still for the last 15 years but it is being made to look so.
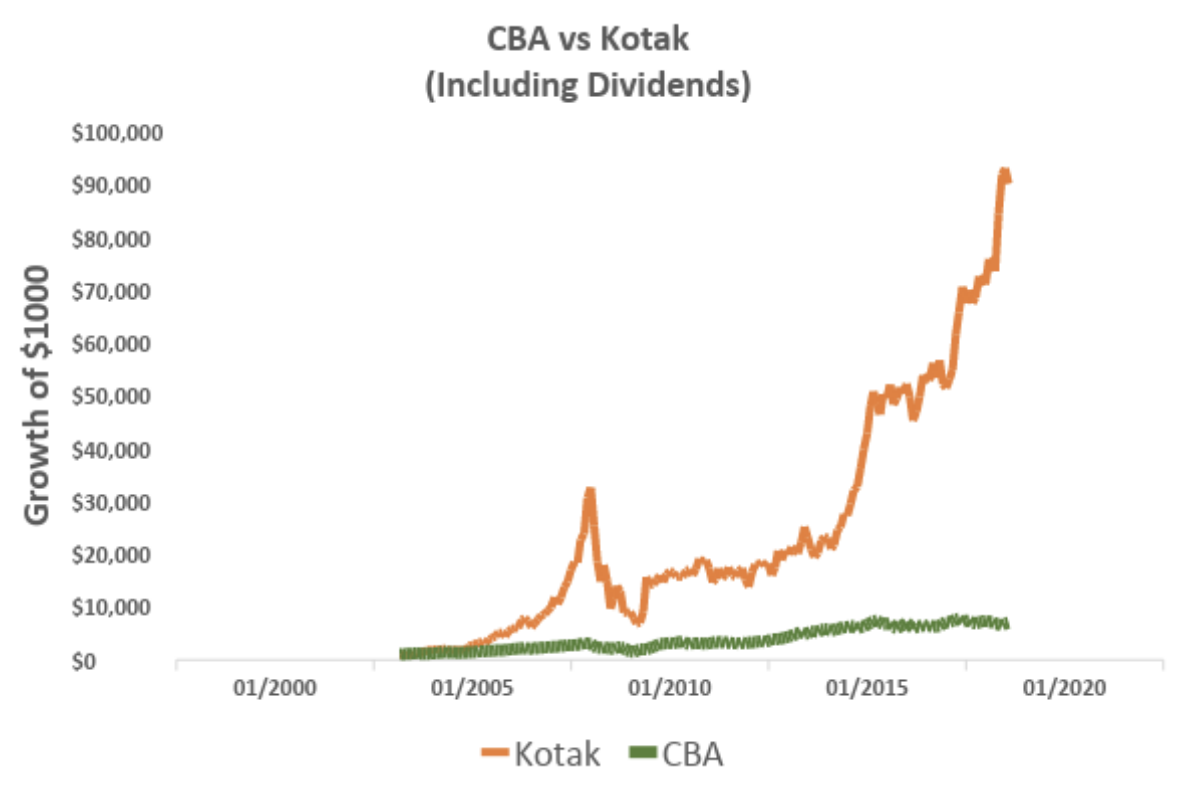
This amounts to a return of 34% per year for Kotak compared to an admirable 13% per year for CBA (including dividends). Remember, this is during a period where Australia’s Banks have been dominant market leaders.
However, the growth of India and its corporates is irrefutable given the underlying fundamentals driving business opportunities. Kotak’s payout ratio of 3% is negligible as it reinvests basically all its profits in the pursuit of growth opportunities.
Banking On India
Banks in India are benefitting from:
- Increasing the number of bank accounts (200m opened over the last 3 years)
- The surge in deposits post the reform of demonetisation
- National Identification Card (Aadhaar) linking to a bank account (now 1.2bn people registered)
- A household debt-to-GDP ratio of 9% compared to Australia’s 122% – leaving plenty of room for growth and potential for significant cross-selling to a massive population
Kotak’s market-cap-to-profit reflects significantly higher P/E’s – highlighting the growth opportunity that exists. We see that reflected in the chart above.
Given the structural tailwinds, the India Avenue Equity Fund invests in Kotak and similar fast growing businesses, participating in India’s growth story.
This article was written by Mugunthan Siva, Managing Director of India Avenue Investment Management (AFSL: 478 233).
Get More Insights From India Avenue
Disclaimer: This article contains general information only and should not be relied upon. The information does not take into account your needs, goals or objectives, so consult a licensed and trusted adviser before you act on the information. Past performance is not a reliable indicator of future performance.