
This short investor article is my trivial attempt to think about the ASX’s best companies, ranked by ROIC. It’s written for investors who, like me, take their long-term direct company investing seriously and are focused on high quality businesses.
If you looking for my ETF recommendations, join us inside Rask Core and get our ETF research for just $0.99 for 30 days.
Why ROIC?
ROIC = return on invested capital.
ROIC is a business metric used to compare how well a company reinvests into its own business. For example, assuming you have checked the company’s financials for weird once-off accounting items, an ROIC of 50% means a company may be able to invest into its own business (e.g. projects or assets) and earn an effective return of 50% per year, before tax and interest costs. This is not the return you get as a shareholder. The ROIC is a business metric, not the investor’s metric.
I love to invest in companies with extremely high ROIC — but only when the ROIC is sustainable and/or growing. Eventually, a company that can reinvest its spare cash (or debt) back into its business and grow profits 50% per year will have a MUCH larger profit base. And eventually, other investors will begin pricing it higher.
⚠️ A lot of companies can have a high ROIC for 1-3 years because of financial engineering and/or accounting standard “flexibility”. Databases and purely quantitative investors get sucked into thinking these are durable businesses when they’re not. Be careful.
That said, few companies can sustain supernormal ROIC for 5, 10 or 20 years. So when these come across your desk, pay attention.
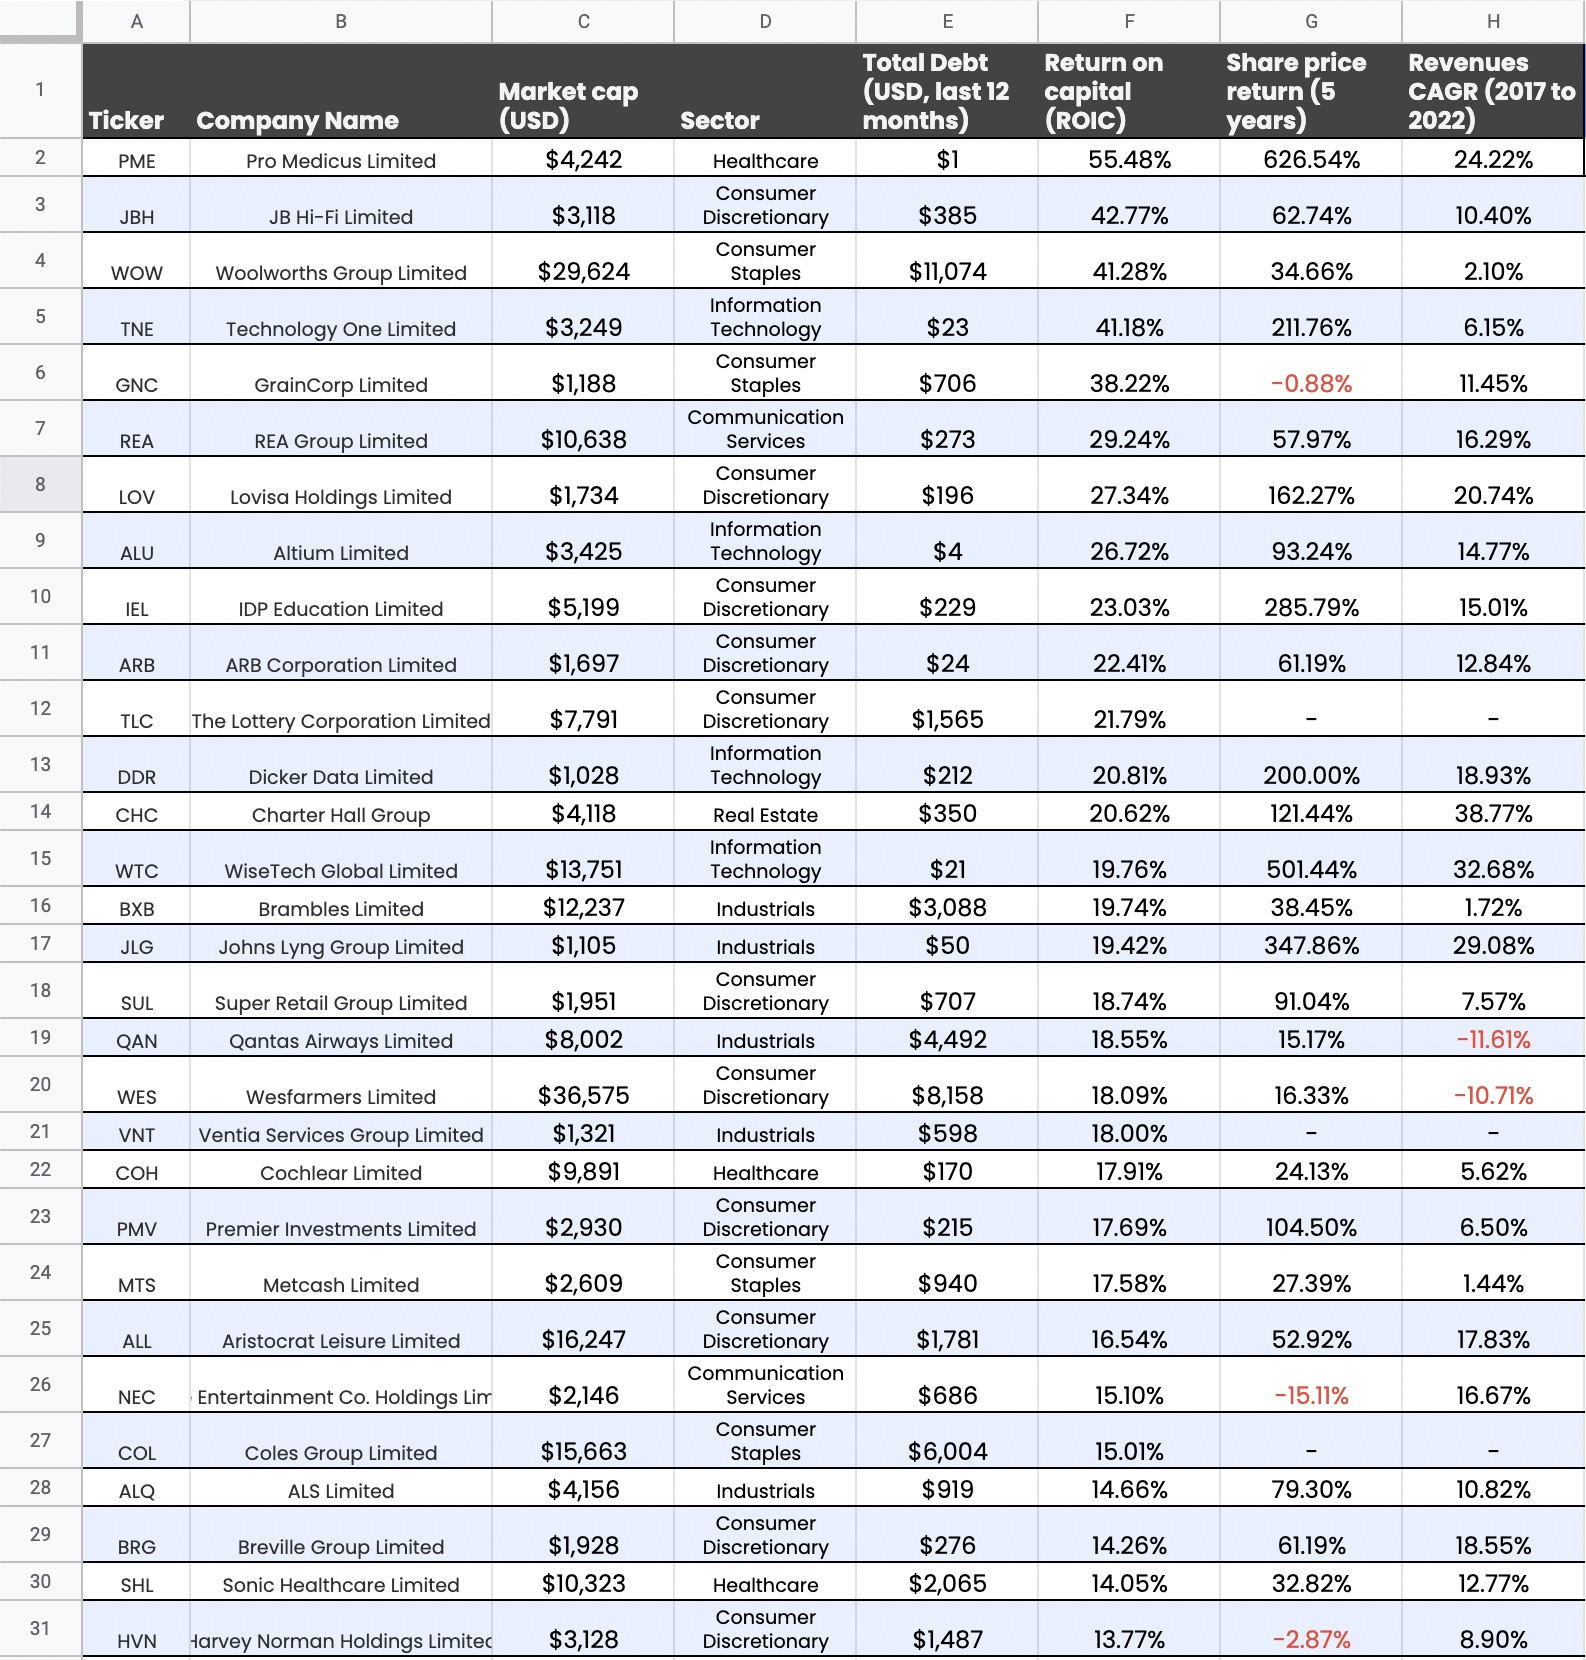
In my ASX list below:
- I have only studied companies with over $1 billion (USD) market cap. Small caps can be awesome but the data degrades the further you go down.
- I excluded financials/banking (e.g. CBA), materials (e.g. BHP) and energy (e.g. WDS). Banking is highly leveraged, so ROIC isn’t a great metric; materials are acceptable for others to invest in, but I don’t, and energy can be an extremely unstable sector due to the cyclical nature of commodity prices.
- I used the fantastic Tikr terminal and pulled the 2022 data for ROIC and total debt. Both of these figures might not be entirely accurate (that’s the challenge with any historical database) because of once-off datapoints or cyclical elements. More on this below.
- I’ve displayed the share price return over 5 years.
- Finally, I displayed the compound growth of sales/revenue over 5 years. More on this below the list.
Why does this list even matter?
The idea of writing this article is, you could interpret this list to be a shortlist of ‘prudent balance sheet + quality business + long-term growth’ companies.
Again, the data is never perfect, so don’t rely on it for a decision — I always check with the source documents (e.g. annual reports). However, this list could surfaces some fantastic business models and franchises. For example, Lovisa, the jewellery retailer is an insanely good business in an industry I often avoid (retail).
A total of 82 companies made it into my list, which (click “file” > “download” > “Microsoft .xlsx”).
I’ll leave it to you to do your own research on these companies but it’s worth noting a few things:
- I’m not a quantitative investor. As I teach in the Value Investor Program, 95%+ of my research is qualitative.
- The list isn’t perfect. For example, ROIC requires companies to be profitable. Therefore, some of tomorrow’s great success stories could have been unprofitable last year, which means they wouldn’t make the list.
- For disclosure, I own Pro Medicus Ltd (ASX: PME). I recommended it as a ‘Buy’ to Rask members many years ago.
- The correlation between the 5-year share price performance and 5-year revenue growth is 0.476. This implies a positive association (i.e. more revenue tends to = more share price growth) but it’s not very strong. BCG data previously showed it takes 10 years for fundamentals to become the dominant explainer variable. With a 2-3 year window, valuation multiple expansion (e.g. PE ratios getting more stretched) is a more powerful explainer of returns. This tells me that the real, business-first, long-term investors amongst us buy-to-hold with a 5-10 year view — anything less than luck plays a bigger role.
- I hacked the correlation between ROIC and share price return — ideally, I would have had average ROIC v share price performance — but even still, this list implies a positive relationship between ROIC and share price return (0.56).
- 20/82 companies are in the “Real Estate” sector (e.g. GPT Group) but these companies have an average ROIC of just 6%.
- 15/82 companies are consumer discretionary (e.g. Lovisa Holdings).
- 15/82 companies are industrials (e.g. Cleanaway Waste).
- 8/82 are IT companies (e.g. Technology One) and 8 are Communication Services (e.g. REA Group).
- 7/82 are healthcare companies (e.g. Pro Medicus) and 7 are consumer staples (e.g. Woolworths).
Let me know what you think on Twitter!
Anyone got some thoughts on this list of ROIC companies and my brief chicken scratches?
I’m not a data scientist. But you can grab the data from the article. https://t.co/XIOkgj0IJs
— Owen Rask 🇦🇺 (@OwenRask) March 8, 2023


