

Australian wealth management platform providers Netwealth Group Ltd (ASX: NWL) and Hub24 Ltd (ASX: HUB) recently released quarterly trading updates.
Below I present four metrics I look at when comparing the two companies against each other and competitors.
1. Funds under administration (FUA)
FUA is the main driver of revenue and subsequent profits for wealth platforms. The platform will charge an annual fee, usually expressed as a percentage of total FUA.
Typically once platform providers reach a certain FUA, revenue from additional fund inflows falls to the profit line.
On June 30 Netwealth had increased FUA $47.1 billion. This is an increase of 49.6% over a one year period.
More impressively, Hub24 increased its FUA by 237.4% over the past year to 58.6 billion FUA. The significant increase in scale is the result of recent acquisitions including Xplore Wealth and Ord Minnett PARS funds.
Removing the effect of non-platform FUA, Hub24 increased its platform FUA by 140.7% to $41.4 billion.
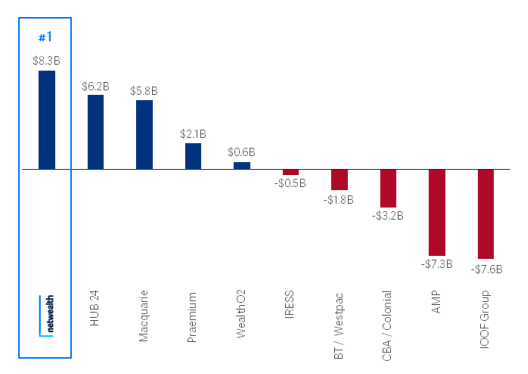
2. Net inflows
Net inflows refer to the number of funds deposited minus funds withdrawn from accounts over a set period. Essentially it indicates which platforms are attracting inflows.
It’s a more accurate indicator than total inflows and FUA as it removes market movement, which can skew results.
Both companies achieved net inflows for the most recent quarter and year. Netwealth increased net inflows of $3.1 billion for the quarter and $9.8 billion for FY21.
Hub24 achieved $3.9 billion in net inflows for the quarter. For FY21, the company recorded $8.9 billion in net inflows.
The chart below is from March 2021 (hence the net inflows is outdated), however, it illustrates both Hub and Netwealth are taking market share from incumbents AMP Ltd (ASX: AMP) and IOOF Holdings Limited (ASX: IFL).
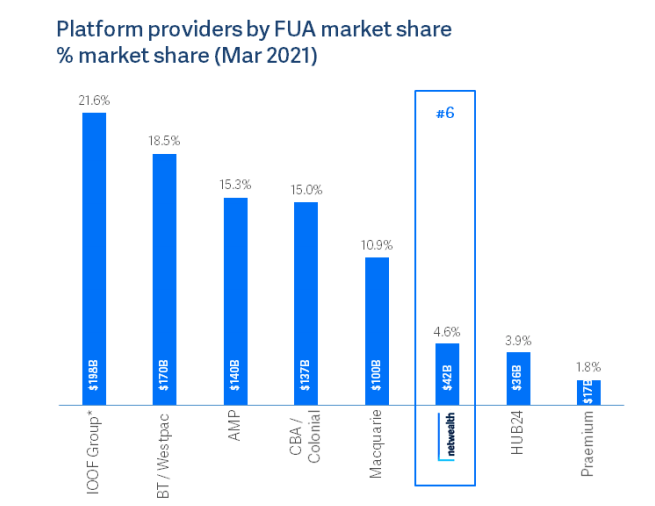
3. Market share
Market share indicates how much FUA each platform has as a percentage of the total market. Australia’s wealth management platform market is estimated to be between $800-$900 billion.
Typically market share is correlated with net inflows. It’s also a good check for when modelling future FUA.
In the most recent market share data, Netwealth grew its market share from 3.6% to 4.6% in the year to March 31, 2021.
Similarly, Hub24 increased its market share from 2.5% to 3.9% over the same period. Despite having more FUA than Netwelath, Hub’s market share is lower as not all FUA is considered platform.
4. Industry awards
Industry awards provide insight into what users of the wealth platform really think. It can be used as a leading indicator for future net inflows and market share.
In the latest Investment Trends Adviser Technology Needs Report Netwealth ranked first for overall satisfaction with a score 80%. Hub24 followed closely behind in second with a score of 78%.
Conversely, Hub24 took out the number one spot in the latest Wealth Insights Platform Service Level Report, which surveys over 600 financial advisors.
Final remarks
Netwealth and Hub24 are often benchmarked against each other. I think this misses the bigger picture.
Both are taking market share, net inflows and FUA away from incumbent providers. Both will likely be winners. By how much remains the big question.