

I remember looking at the Westpac Banking Corp (ASX: WBC) share price during the COVID crash of 2020 and thinking to myself ‘I reckon the WBC share price is starting to look decent value today but I’m not sure how fast it’ll take to recover’. I didn’t buy any bank shares, including WBC shares, in the crash. And here’s how the WBC share price and ANZ Banking Group (ASX: ANZ) shares have responded. Darn!
ANZ & WBC share price – 1 year chart
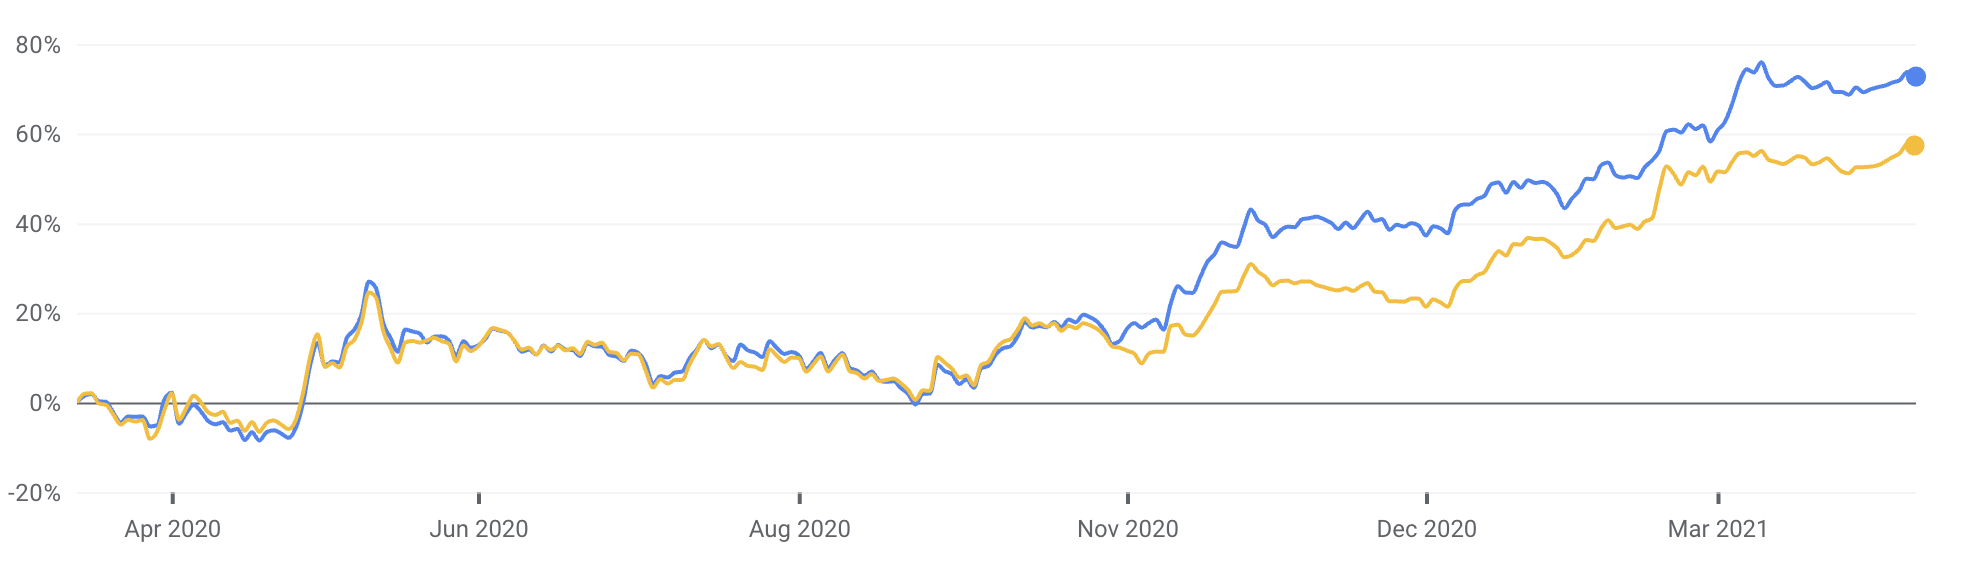
In the past year, the WBC share price has jumped 57% while ANZ shares are up 73% — not including any fully franked dividends paid. That’s impressive.
Westpac is the second-largest ‘Big Four’ bank, and a financial services provider, headquartered in Sydney. Alongside CommBank (ASX: CBA), ANZ and National Australia Bank (ASX: NAB), Westpac finances homeowners, investors, individuals (via credit cards and personal loans) and businesses.
5 steps to research WBC shares
Culture is important
Even in a big bank that employs thousands of people around the world, good workplace and culture amongst staff can lead to improved retention of high-quality personnel and, in turn, that determines the long-term success of a company.
One way Aussie investors can take a ‘look inside’ a company like Westpac Banking Corp is to use an HR/jobs website like Seek. Seek’s website includes data on companies, including employee reviews. According to the most recent data we pulled on WBC, the company’s overall workplace culture rating of 3.4/5 was above the banking sector average rating of 3.23.
Net interest margins (NIMs)
Banks such as WBC or CBA need to leverage their balance sheet with debt while also getting good profit margins on the money they lend to make their businesses profitable. In basic terms, a bank gets money from term deposit holders and wholesale debt investors and lends that money onto homeowners, businesses and investors financing projects. The difference between what a bank pays to savers and what it makes from mortgage holders (for example) is the net interest margin or NIM. Remember: when it comes to NIMs, the wider the margin the better.
If you are forecasting the profits of a bank like WBC or National Australia Bank, knowing the amount of money a bank lends and what it makes per dollar lent to borrowers is essential. That’s why the NIM is arguably the most important measure of a bank’s profitability for analysts at sell-side and buy-side financial firms. Amongst the major banks on the ASX, we calculated the average net margin to be around 1.93%. WBC’s lending margin was 1.9%, highlighting it delivered a slightly lower-than-average return from lending compared to its peer group. This can happen many reasons, which are worth investigating.
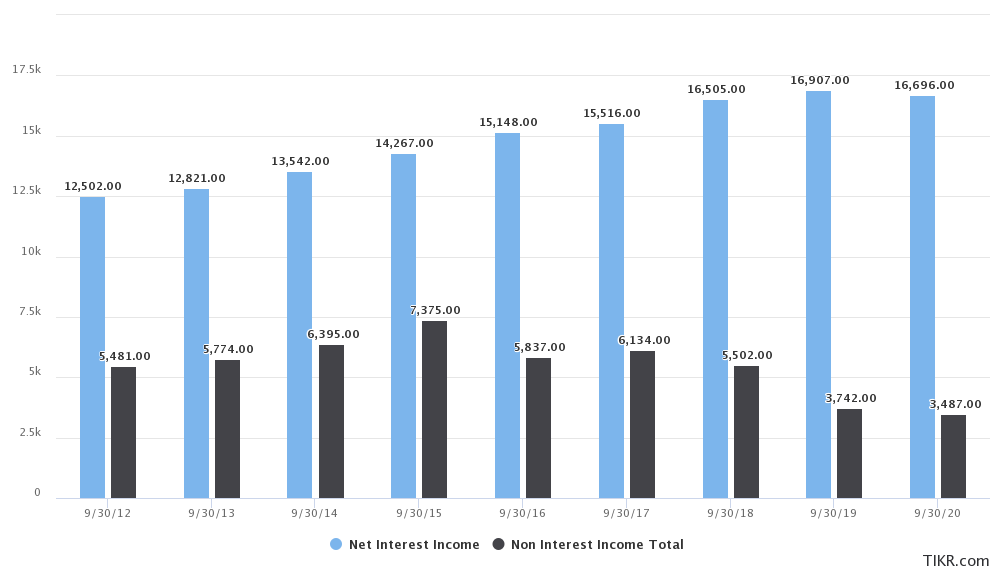
The reason I would study the NIM so closely is because Westpac Banking Corp earned 83% of its total income (akin to revenue) just from lending last year.
WBC’s return on shareholder equity (ROE)
The return on shareholder equity or just ‘ROE’ for short helps you, the investor, compare the profit of a bank against its total shareholder equity, as shown on its balance sheet. The higher the ROE the better
. Westpac Banking Corp’s ROE in the latest full-year stood around 7.3%, meaning for every $100 of shareholder equity in the bank it produced $7.30 in yearly profit. This was more than the sector average of 6.99% but below long-term averages (10% plus). Keep in mind we just endured COVID which brought unique challenges to banks.
CET1: Back-up bank capital
For Australia’s banks, the CET1 ratio (aka ‘common equity tier one’) is paramount. CET1 represents the bank’s capital buffer which can go towards protecting it against financial collapse. According to our numbers, Westpac Banking Corp had a CET1 ratio of 11.1%. This was below the sector average but still looks pretty good against APRA, the bank regulator’s, numbers for ‘unquestionably strong’. Speaking of regulation, Westpac is being taken to court by ASIC, the financial services watchdog, following the sale of consumer credit insurance. This follows heaps of other issues brought about by AUSTRAC (anti-money laundering authority).
WBC dividend valuation
A dividend discount model or DDM is one of the easier and more efficient ways to value bank shares. It uses dividends to estimate the share valuation. Can you read more about DDM valuations in my free tutorial. Our simple DDM valuation of WBC shares is $4.89 using last year’s dividends (covid affected).
Using an ‘adjusted’ dividend payment of $1.07 per share, which takes analyst forecasts into account, the valuation goes to $16.86. The valuation compares to WBC’s current share price of $25.12. However, keep in mind my model is simple, doesn’t include franking credits (which can boost dividends for eligible investors by 30% — and therefore the valuation). Use our free franking credits calculator to see how it works.
Summary
In summary, don’t make a decision to buy or sell WBC shares based on this article. Please go away now and consider all of the risks and ideas I presented here, as well as the importance of understanding the housing market and regulation.
While you’re at it, you might also consider shares of companies like Washington H. Soul Pattinson (ASX: SOL), BHP Group Ltd (ASX: BHP), the list of Australian shares ETF or at least grab a copy of our free ETF investment report below.


