

The Ansell Limited (ASX: ANN) share price is climbing this morning as investors digest the company’s full-year result.
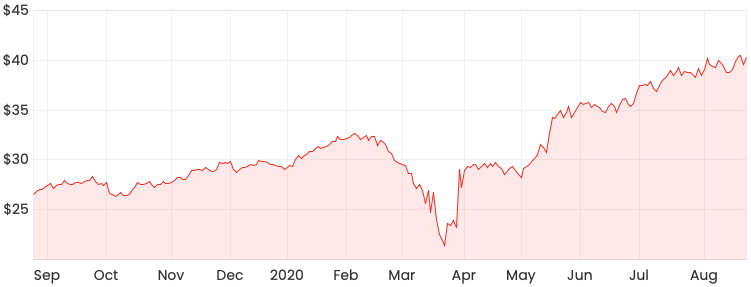
As you can see in the 1-year share price chart below, Ansell has been a strong performer in recent months on the back of heightened demand for personal protective equipment.
The 5 key points
- Sales of US$1.61 billion, up 7.7% on FY19 and 9.3% on a constant currency (CC) basis;
- Adjusted earnings before interest and tax (EBIT) grew 21% to US$219.7 million;
- Adjusted profit increased by 19% to come in at US$158.7 million;
- Operating cash flow of US$191.7 million with cash conversion of 117.7%; and
- A final dividend of 28.25 US cents
Making sense of the numbers
The adjusted numbers above exclude transformation costs in FY19 so as to better compare the performance of the underlying business. Ansell commenced a multi-year transformation program in FY18 designed to reduce the overhead structure of the post-sexual wellness business, capture the benefits from an improved manufacturing footprint and progress CEO succession.
EBIT growth was supported by sales growth, transformation benefits and net favourable raw material costs. This was partially offset by increased costs due to temporary plant shutdowns, other COVID-related costs and adverse foreign exchange movements.
Unsurprisingly, Ansell noted there were different growth rates throughout FY20 which varied across strategic business units due to the impact of COVID-19. The pandemic drove significant organic sales growth for the Exam/Single Use and Chemical Protective Clothing units, whilst demand was particularly elevated in the North America and Asia Pacific regions.
Segment performance
Breaking down performance, Ansell operates across two key segments: the healthcare global business unit (HGBU) and the industrial global business unit (IGBU).
Healthcare, which comprises surgical and examination gloves and healthcare safety devices, achieved sales of US$894.6 million, up 13.8% on the prior year. Within HGBU, Exam/Single Use delivered organic sales growth of 18.2%, while Life Science grew sales by 16.3% on the back of strong demand for BioClean products and major account wins in North America.
HGBU margins improved by 135 basis points, benefiting from lower raw material costs, manufacturing efficiencies, higher volumes and pricing initiatives. Together with higher sales volumes, this contributed to 23% growth in EBIT to US$141.8 million.
Shifting gears, the industrial GBU comprises multi-use hand and body production solutions for industrial work environments and specialty applications. The unit achieved more subdued growth compared to HGBU, with FY20 sales coming in at US$719.1 million – up 4.2% in constant currency and 2.2% on a reported basis.
Within IGBU, the Mechanical strategic business unit saw a 2% decline in organic growth due to the COVID-related slowdown in economic activity in the automotive, oil and gas and heavy industries. This was partially offset by 7.9% growth in the Chemical unit, driven by strong demand for the company’s Alphatec Chemical Protection Clothing.
IGBU EBIT came in at US$98.7 million for the year, down 6.% on a reported basis but up 7% in constant currency.
Ansell’s dividend
Ansell declared a final dividend of 28.25 US cents, an increase of around 9% compared to the final dividend in FY19. This takes full-year dividends to US 50 cents, up 7% on the prior year.
Using a USD/AUD exchange rate of $1.40, this full-year dividend translates to a dividend yield of around 1.7%.
Now what?
Ansell expects the Exam/Single Use industry to continue to see significant supply shortages, which are likely to result in increased costs from outsources suppliers. As a result, the company said its sales pricing will continue to be dynamic.
Additionally, Ansell anticipates that the outlook for its strategic business units will remain mixed throughout FY21, with strong growth in Exam/Single Use, Chemical, Surgical and Life Science, tempered by weakness in Mechanical.
Overall, the company expects organic growth to be “substantially” higher than the 3-5% long-term target levels, driven by price and volume increases.
In terms of guidance, Ansell is expecting FY21 earnings per share to be in the range of US$1.26 to US$1.38. The midpoint of this range represents 8% growth on FY20.
On the whole, I think these were an impressive but largely expected set of results for a company positioned on the frontline of the pandemic. Ansell will likely benefit from heightened demand in the coming year but I’d rather invest in the companies in the free report below for growth.