

Sunny Bangia of Antipodes Partners speaks to the opportunity from a transition already underway amongst China’s largest online e-commerce businesses, including JD.com and Alibaba.
“The integration of online, offline, logistics and data across a single value chain.” – Jack Ma
Almost 20 years ago, the SARS coronavirus emerged in Southern China and quickly developed into what became known as the first pandemic of the 21st century. In the midst of the outbreak in 2003, JD.com (NASDAQ: JD) (now China’s largest retailer) was launched. Its founder Richard Liu was forced by circumstance to shift from a physical store to the internet.
The first pandemic of the century wasn’t to be the last. Now in a similar manner, the current COVID-19 coronavirus is accelerating the longer-term secular adoption of e-commerce and at the forefront of this generational shift is Alibaba (NYSE: BABA) and JD.com
Irrational extrapolation
Since the SARS episode, China has led the world in e-commerce adoption and innovation. Historically, structural growth in online retailing has been supported by a large, technologically savvy population and a lack of competitive large-scale big-box retailers. Retail sales growth outstripped income growth as consumer leverage increased from a low starting point.
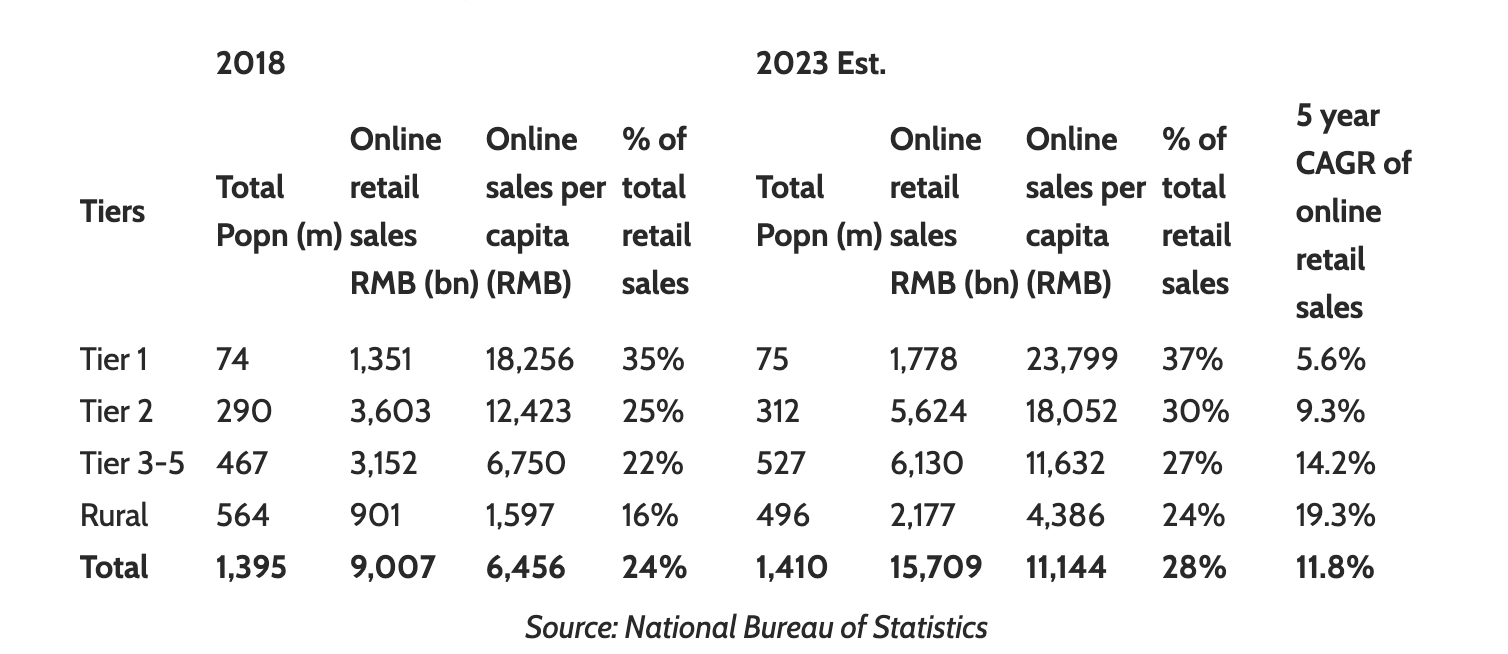
China retail sales have grown at ~10% for the past five years, reaching RMB 38.1 trillion, or 42.5% of total GDP. Within this, online retail has been compounding at a much faster rate of 36.5%, reaching RMB 9.0 trillion, or 24% of total retail sales[1]. E-commerce market growth is slowing to ~12% pa with share shifts driven by catch-up adoption in the lower-income demographics where we expect Tier 3 and below cities to account for roughly 65% of all online market growth.
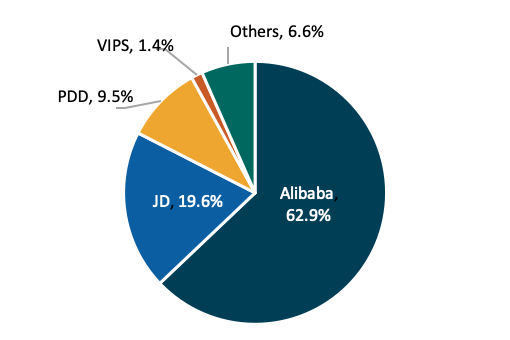
While Alibaba, whose wide-ranging businesses span from e-commerce, offline retail, fintech, online video, maps, browsers and artificial intelligence, dominates with a GMV (gross merchandise value) of over US$850 billion (for context, this is 2x Amazon), Chinese e-commerce is largely an oligopolistic market with both Alibaba and JD.com well placed. While this is not lost on the consensus, in our assessment the market is undervaluing two aspects of the case: firstly, the opportunity for these two giants to take share amongst the ~1 billion Chinese that live in Tier 3 and below cities (where online adoption lags the top tiers by a third); and secondly, the new retail or omnichannel opportunity.
Figure 1: China online market share (2019)
Multiple ways of winning
Competitive dynamics: Online players dominate offline
The key difference between China’s retail competitive environment and the US is that Alibaba is 14X the size of the largest offline player, i.e., it is hugely dominant across all retail. By comparison, Amazon is still only half the size of Walmart which is why so much of Amazon’s focus is on outperforming its offline rival on delivery time.
Figure 2: China Online Penetration by City Tiers
As their market share and power grows, we expect Alibaba and JD.com’s take rates/GPM (the percentage of GMV that flows into revenues/Gross Profit Margin) to increase at the expense of its merchants/suppliers’ profitability.
Product cycle: Omnichannel convergence, led by online
What ultimately drives shopping? Needs of course, but also habits, impulses, experiences and social desires. Over time, it may not matter where we notice the product, but rather where we try it, pay for it, and how it is delivered. The future of retail will involve the convergence of data rich e-commerce platforms with offline retail. These omnichannel initiatives address a target market that is five times larger than online retail but one-fifth as profitable.
Organised channels for fresh grocery sales are hugely under-developed compared to those in the US, where established super/hypermarkets account for over 90% of sales. In China, wet markets (the Asian equivalent of farmers markets that sell fresh meat and produce) still account for more than 70% of fresh grocery. Given the COVID-19 outbreak likely originated in a Wuhan wet market, China will now permanently modernise its fresh food supply chain. Alibaba/Hema already has 20% market share in fresh food e-commerce with only 3% migration online with breakeven now approaching. In terms of sizing this opportunity, the entire offline fresh grocery market is worth RMB 5,511b or equivalent to 46% of current online retail sales. Alibaba and JD.com are deploying multiple strategies to attack this opportunity including partnerships with offline players.
Alibaba’s “New Retail” initiatives include Lingshoutong (LST) and Hema. LST plugs existing small merchants into Alibaba’s logistics and data services, hosted on Alicloud, in return for a monthly commitment. For example, LST allows Nestle China to directly connect with smaller merchants cutting out multiple layers of distribution. Meanwhile, merchants use the LST app to identify products that are in greatest demand and changes in trends, to re-order online without going through traditional channels. LST has gained around 1.3 million merchants. Brands typically “give away” anywhere between 8-10% of their revenue to such distribution channels. In real dollars FMCG brands are “losing” US$55-75b pa to a relatively inefficient distribution channel. Alibaba’s LST initiatives are aimed at streamlining this spend.
Alibaba’s high-tech Hema retail stores serve as walk-in restaurants, fresh food/grocery outlets, and warehouses for online delivery (within 30 minutes in a three-kilometre radius). Rollout of the 200-store network started in June 2017 and is expanding quickly with two stores added each week. Hema stores in operation for over 18 months are reporting revenues of RMB 50,000 per square metre (or more than $7,000/sqm), five times higher than traditional offline stores largely because sixty percent of instore sales are fulfilled via the online delivery channel.
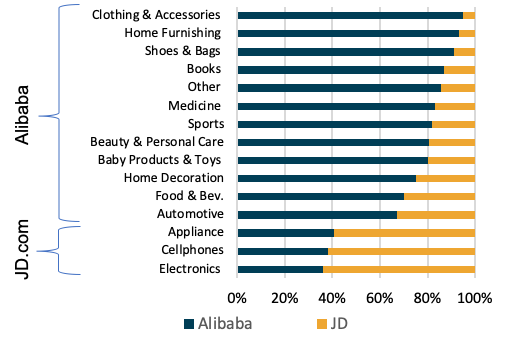
While both companies are targeting the demand for high-end branded products, JD.com’s 1P (First Party) model is different to Alibaba’s 3P (Third Party) model in that it holds inventory in multiple warehouses close to urban population concentrations (similar model to Amazon) to reduce delivery times. As such it is more suitable for standard products with high natural inventory turns. Hence, JD.com leads in electronics and appliances and is increasingly taking share in FMCG. Longer-term both 1P and 3P models will co-exist with different suitability across products and customers.
Figure 3: Alibaba and JD relative GMV (Gross Merchandise Volume) market share (Q4 2019)
Against the backdrop of China’s total online population of 967 million internet users, JD.com with 350 million users has room to grow, especially in lower tier cities. Further, COVID-19 highlighted JD.com’s service quality and has reinforced user loyalty.
Regulatory: Resist the urge to gouge
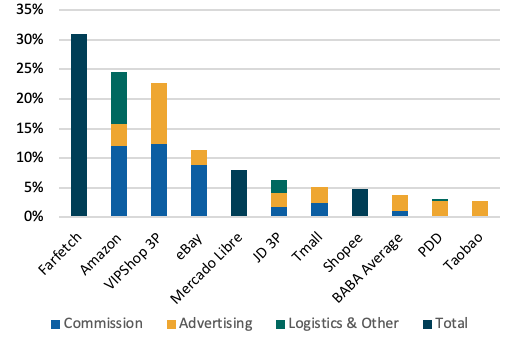
In all jurisdictions globally, emerging monopoly-like e-commerce positions will be scrutinised. Importantly, within the Chinese context, take rates are much lower than global peers which means the platforms are actively supporting third party brand and merchant profitability which should ultimately lessen the risk of regulatory intervention.
Figure 4: E-commerce platform take rates
Further, throughout the COVID-19 crisis, both Alibaba and, in particular, JD.com’s 1P logistics platform, aggressively supported the Chinese Government’s efforts, including the supply of emergency medical and personal protective equipment.
At a much higher level, both Alibaba and JD.com serve the nation’s interest in terms of tilting the economy towards consumption away from fixed-asset investment while boosting retail industry productivity.
Management and financial: Positive transitions
Alibaba has demonstrated an ability to drive changes in behaviour and build a fortress of high-quality business assets: China’s largest e-commerce, digital payment and cloud infrastructure platforms. The vision of Alibaba’s founder Jack Ma lives on and the recent senior leadership transition appears to have gone smoothly.
Over the past year, JD.com initiated a round of management changes which included Richard Lui stepping back from day to day management and a refocus on “high quality growth” covering user experience/retention and category growth. The strategy is delivering clear results with JD.com surpassing Taobao to become number one for user experience/service in the most recent Net Promoter Score (NPS) survey. As a result, JD.com is once again growing users after a dormant 2018/early 2019.
Style and macro: Affordable growth and quality
Throughout the current protracted period of low rates and concerns over global growth, investors have been paying increasingly higher multiples for businesses with defensive and structural growth qualities. Alibaba and JD.com represent an attractive way for investors to gain such style exposure, that is, adding a cheaper expression of quality growth to portfolios.
Valuation/Margin of Error
We forecast Alibaba to grow its revenues at around e-commerce market growth which is currently high teens, but will likely moderate to low teens. The stock is currently priced on a CY21 PE of 20.0x (without any assumed increase in take rate). Total losses on the new retail ventures amount to $4.5 billion (equivalent to 15% of FY19 reported EBITDA) but importantly are on a declining trend. Further, we have very conservative assumptions on the ultimate value of Alibaba’s cloud and payment businesses.
We forecast JD.com to grow revenues ahead of e-commerce market growth and achieve a FY21 OPM (Operating Profit Margin) of 2.5%, up from 0.8% in FY19. It is priced on a CY21 PE of 20x. We forecast the company to ultimately achieve a sustainable 3.5% OPM. Similar to Alibaba, a fair value PE for both stocks would by closer to 25x, given the sustainability of low teens profit growth.
Where could we be wrong and what could the margin of error be? As the Chinese e-commerce market matures, increasingly the three largest players (with group buying platform Pinduoduo the third in the trio) will compete more aggressively. Increasingly, speed and quality of delivery will matter which highlights Alibaba’s key weakness – its merchants are effectively responsible for warehousing and delivery meaning Alibaba does not fully control the customer experience. We would expect Alibaba to internalise some of these fulfillment services over time, but at what operating and capital cost – this is an issue worth monitoring closely.
Contextual margin of safety
Figure 5: 2021 EV/EBITDA v forward 3 year EBITDA CAGR – Alibaba v peers
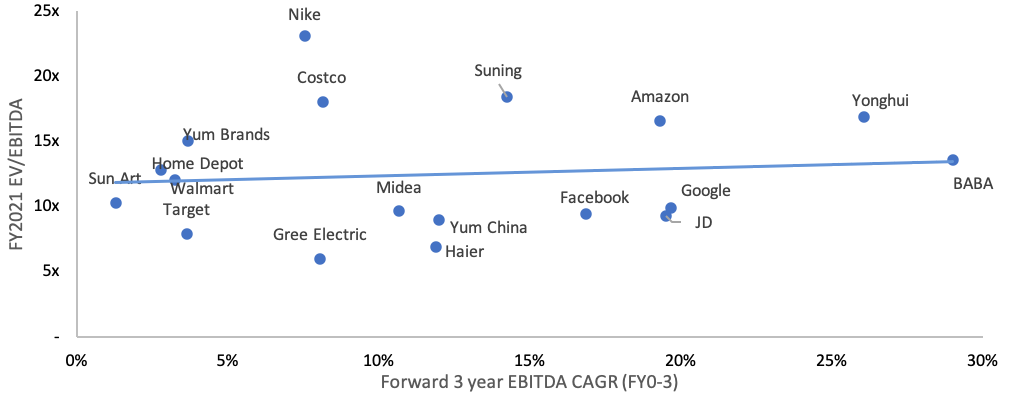
As seen in Figure 5, Alibaba and JD.com are currently priced on attractive multiples relative to their forward growth profiles compared to other large retail and internet platform peers globally.
We have used a headline EBITDA multiple, not because we think this is the ultimate valuation metric, but rather as the least-worse approximation of underlying cashflow multiples for this group of companies.
This excellent article was written by Sunny Bangia, Portfolio Manager of the Antipodes Asia Fund. You can find out more about Antipodes and Sunny by clicking here.
[ls_content_block id=”14948″ para=”paragraphs”]