

ASX reporting season is the premier event of the investing calendar with more results to read than you can poke a stick at.
With reporting now largely over, I think it would be good to touch base on the FY19 results and FY20 expectations for XRF Scientific Limited (ASX: XRF), a small company I detailed on Rask Media in April 2019.
XRF’s Results
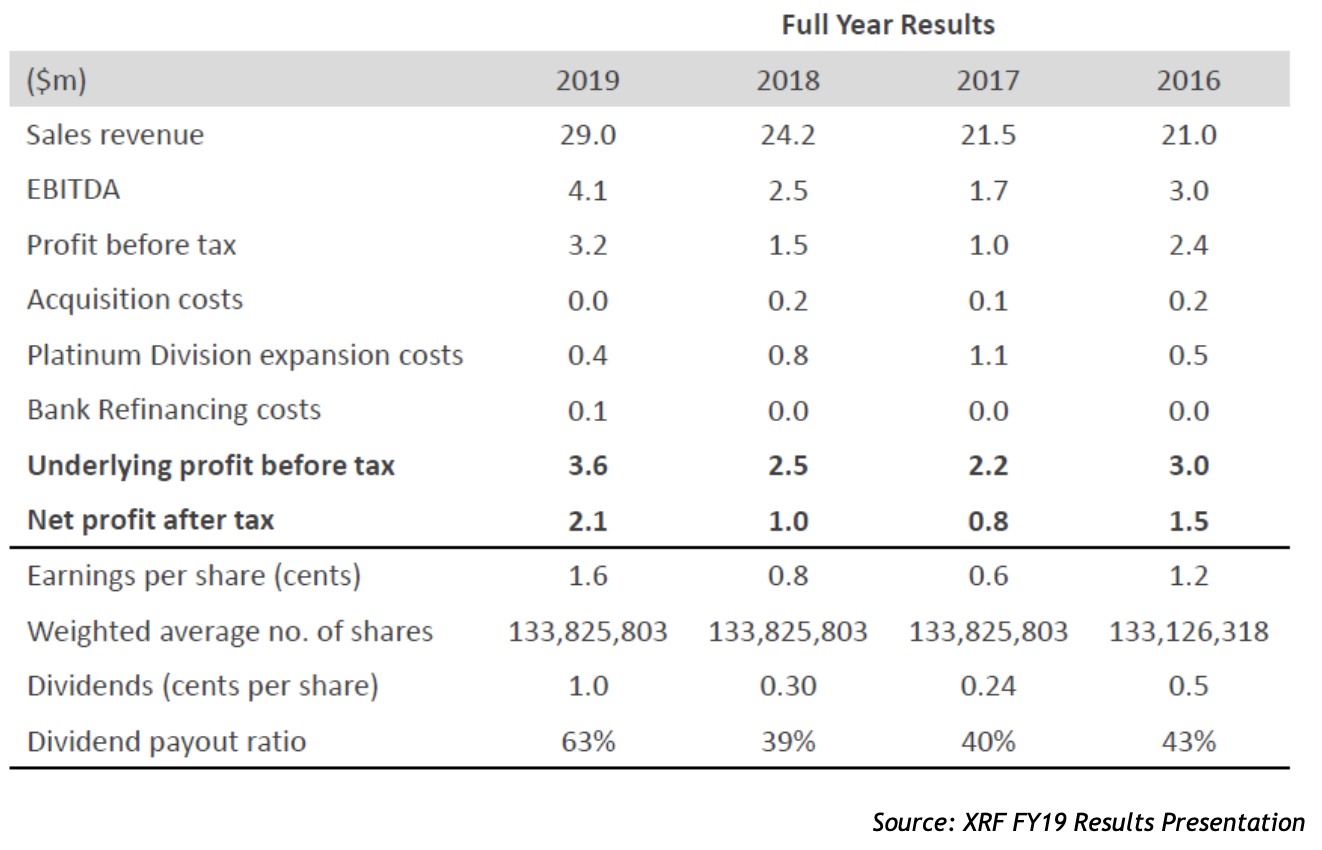
Overall, XRF reported a great set of results with revenue reaching a record level of ~$29m, which was ~20% higher than FY18. All three divisions contributed to the result, with the Precious Metals (PM) division leading, growing by 19.4% to $13.1 million in revenue as the prior investment and expansion of this business unit bear fruit.
Capital Equipment delivered a record result, delivering on a strong capital expenditure (CAPEX) cycle from its customers. The Consumables division grew a more modest 6.2% for FY19 (expected 8% to 10%), which was a little disappointing considering how exploration spend and metres drilled had been tracking over the year.
In addition to record revenue, operating margins showed improvements across each division with group EBITDA margin increasing from 10.1% to 14.2%. Strong revenue growth in conjunction with strong margin expansion led to strong growth in profitability and free cash flow generation.
The following educational video explains EBITDA:
XRF’s EBITDA grew 67% to $4.1 million whilst operating NPAT grew 108% to $2.1 million. With ongoing investment requirements into the business moderating, also boosting free cash flow, this allowed for a higher dividend, which was well ahead of my own expectations as XRF declared a dividend of $0.010 versus my expectation of $0.007.
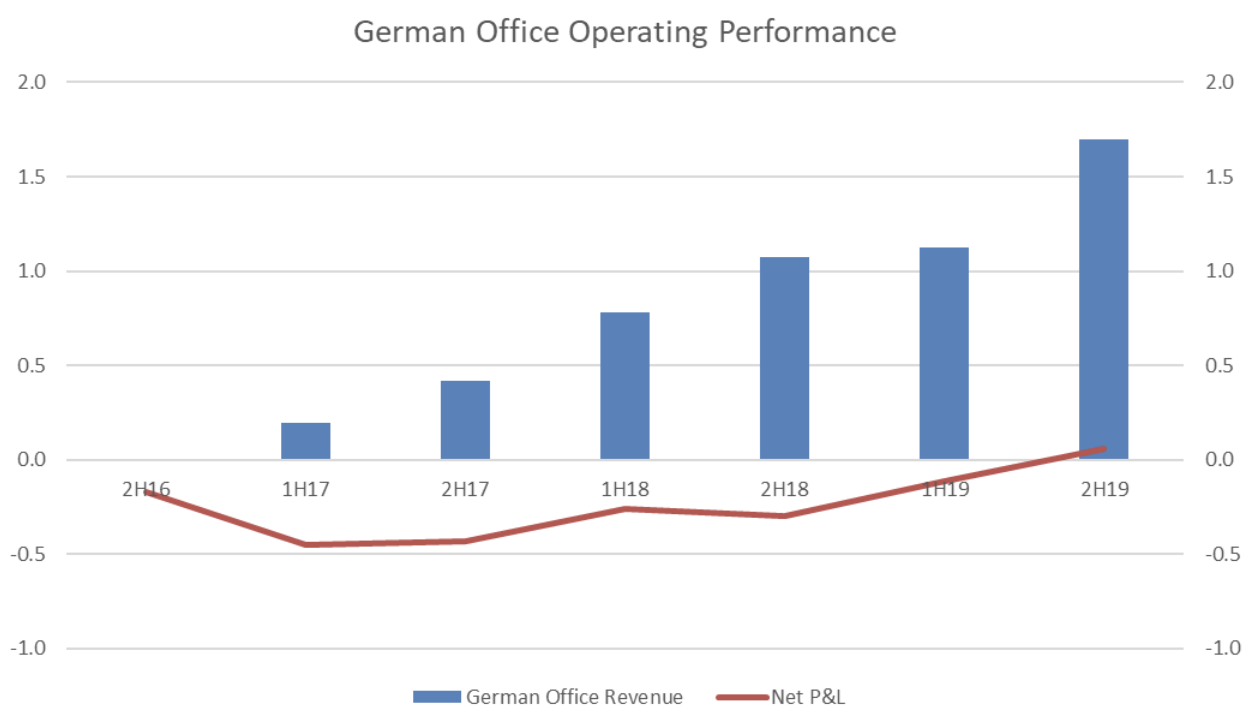
Notably, the German office achieved profitability in the second half of FY19 with +$57k. For the whole FY19 period, the office reported a loss of 57K. The improved performance in this office, coupled with other one-off expenses from investment saw margins in the PM Division expand from 1% to 7%.
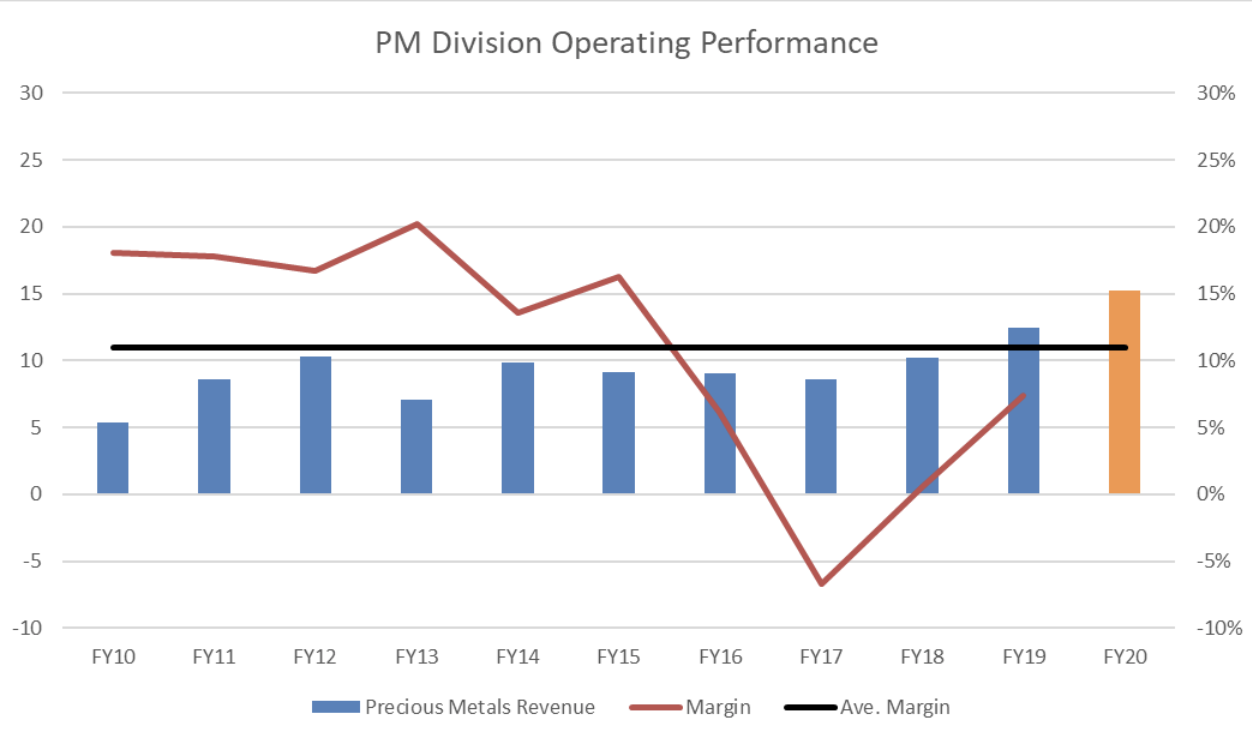
As this part of the division hits scale, and with a strong pipeline of customers to drive top-line growth, I expect the margins in the PM division to continue to expand significantly, at least moving back towards historical levels (average of ~12% since IPO) and be a key driver to overall profit growth for XRF in the next two to three years.
Looking forward to FY20, I believe XRF is well-positioned to deliver strong revenue growth at a rate in line with that achieved in FY19. I think the PM division is positioned to deliver 15%+ growth, whilst Consumables should be placed to track between 8% to 10% growth. In my view, the biggest risk to revenue growth could be from the Capital Equipment division. Whilst management reiterated that the order book level remains at highs, which suggest year-over-year growth is likely, revenues can be lumpy, which can make a record FY19 result for the division a tough comp.
With margins still below long-term historical averages in each division (PM division exampled in the graph below), I believe that XRF still offers strong operating leverage. Should XRF achieve revenue growth consistent with that of FY19, and margin expansion in line with my expectations, this could result in NPAT and dividend growth in excess of 50% for FY20.
My XRF Valuation
At the time of my original article in April 2019, XRF traded on an EV/EBITDA and P/E multiple of ~5.5x and ~10.5x, respectively, for FY19. Based on my forecasts for FY20, XRF trades on an EV/EBITDA and P/E multiple of ~4.9x and ~8.8x respectively.
In addition, assuming a payout ratio of ~65% is maintained in FY20, XRF would offer investors a net dividend yield of ~7.5% today. I reiterate that given the level of growth, improved diversification and quality of their product offering, I believe XRF should trade towards the top end of their peer group which is still largely considered mining services. This equates to an EV/EBITDA multiple of around ~9x or a P/E of 15x+ and implies fair value for XRF in the mid to high $0.30 range.
It is also worth noting that XRF has stated that it is still looking to continue to make acquisitions that can enhance its market position or add a complementary product to its offering. However, if in two-to-three years the company hasn’t made any material acquisition nor identified another significant opportunity to re-invest back into the business, it is likely that cash will continue to pile up on the balance sheet.
In this scenario, I believe the company would be able to make a material capital return to investors via a special dividend, which would also allow XRF to distribute the benefit from the $5.7m in franking credits accrued on the balance sheet.
[ls_content_block id=”18457″ para=”paragraphs”]
Special note: XRF is a small and illiquid company, and like all companies, it has an uncertain future. Therefore, an investment in XRF should be considered high risk.
Disclosure: At the time of publishing, Josh owns shares in XRF.