What is the Commonwealth Bank of Australia (ASX: CBA) share price really worth?
Within a minute I’ll show you how some analysts might use CBA’s dividends to put a fair price on the shares of the big bank. The technique can be used for National Australia Bank Ltd. (ASX: NAB) or Westpac Banking Corp (ASX: WBC) too.
First things first, I need to give you a word of warning.
The investment analyst model I’m about to hand you is effectively a carpenter’s hammer. If you swing it wildly or you use it inappropriately you’ll do more damage than good. In other words, if you put unrealistic numbers into the model, you’ll get an unrealistic result out of the model. In doing so you could lose more money than you start with.
The garbage in garbage out rule applies.
CBA Share Dividend Model
This model would be used by analysts valuing a company with reliable dividends. It should be used alongside other valuation models.
For context, the actual valuation of a company probably takes up 5% of the time I spend researching a company. Why? If you’re a long term investor, getting ‘the company part’ right is more important than attempting to predict a valuation to the nearest cent.
Here’s what you need to lose the model:
- An estimate of CBA dividends per share. You could use the historical dividends or your best guess. In the analyst community, best guesses are known as ‘forecasts’. Be conservative.
- Risk rate. Expressed as a percentage, the model is sensitive to this input so take your time. In our free education tutorials, I go into detail about picking the risk or discount rate for various valuation models. Click here to take our free online share valuation course.
- Growth rate. Again, this your best guess. We’re forecasting growth into perpetuity/forever, so anything materially above the inflation rate (2-4%) could be hard to justify for a blue chip like CBA.
The Formula
The dividend model formula is simple: dividend / (risk rate – growth rate) = valuation.
I’ve assumed CBA’s dividend to be $4 per share, which is slightly below the five-year average dividend payment to shareholders. You can see how the risk and growth inputs affect the valuation:
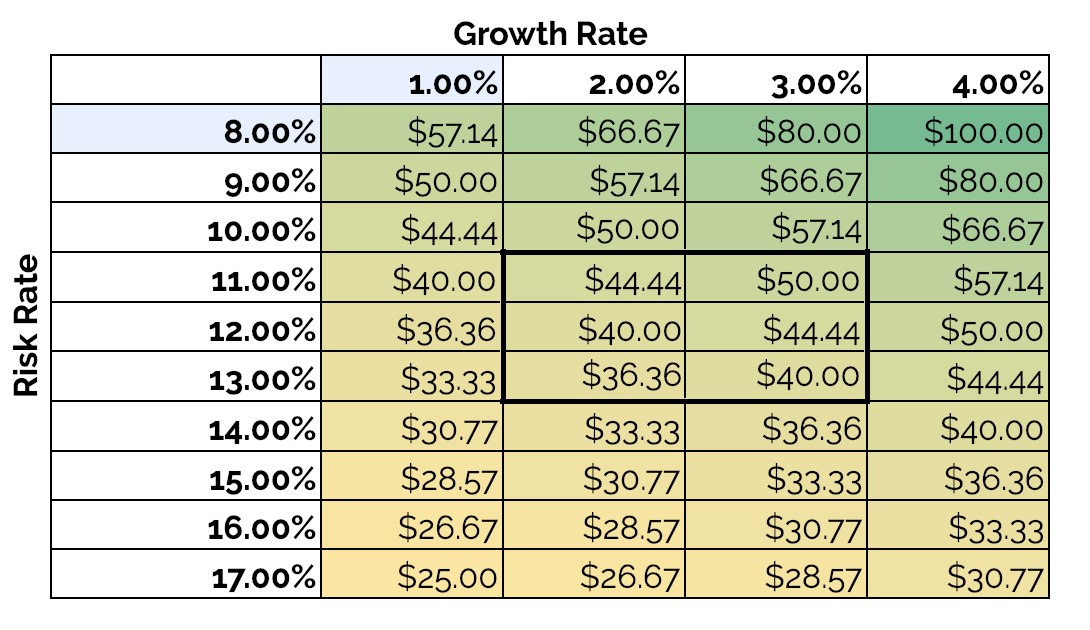 The average valuation of the six cells within the bold brackets is around $42.50. For the entire table, the average valuation for CBA is $44.81. Both valuations are materially below the current CBA share price of $73. But as I said, garage in garbage out. You would want to understand the bank’s strategy, competition and outlook before running this model.
The Verdict
To predict the valuation of a share like CBA with any accuracy is very difficult. In fact, I think it’s specifically impossible. That’s why, when it comes to valuation, I think it’s best to be generally correct than specifically wrong.
How do you get to being ‘generally correct’ instead of specifically wrong?
The answer is you have to do plenty of research into the company and sector and use multiple valuation models (dividend models, comparables, cash flow models, ratios, etc.).
The other way you can use valuation is to take the targets set by other analysts — according to The Wall Street Journal analysts value CBA shares at $71.83 — and calculate what would be required from CBA to justify that valuation. As you can see above, to get to a valuation materially above the current CBA share price of $70-ish you have to use a very low risk rate or quite a high growth rate — other both!
To learn more about how I would compare CBA shares to another bank like ING Groep NV (NYSE: ING) click here.
3 Proven ASX Dividend + Growth Shares
[ls_content_block id=”14945″ para=”paragraphs”]