

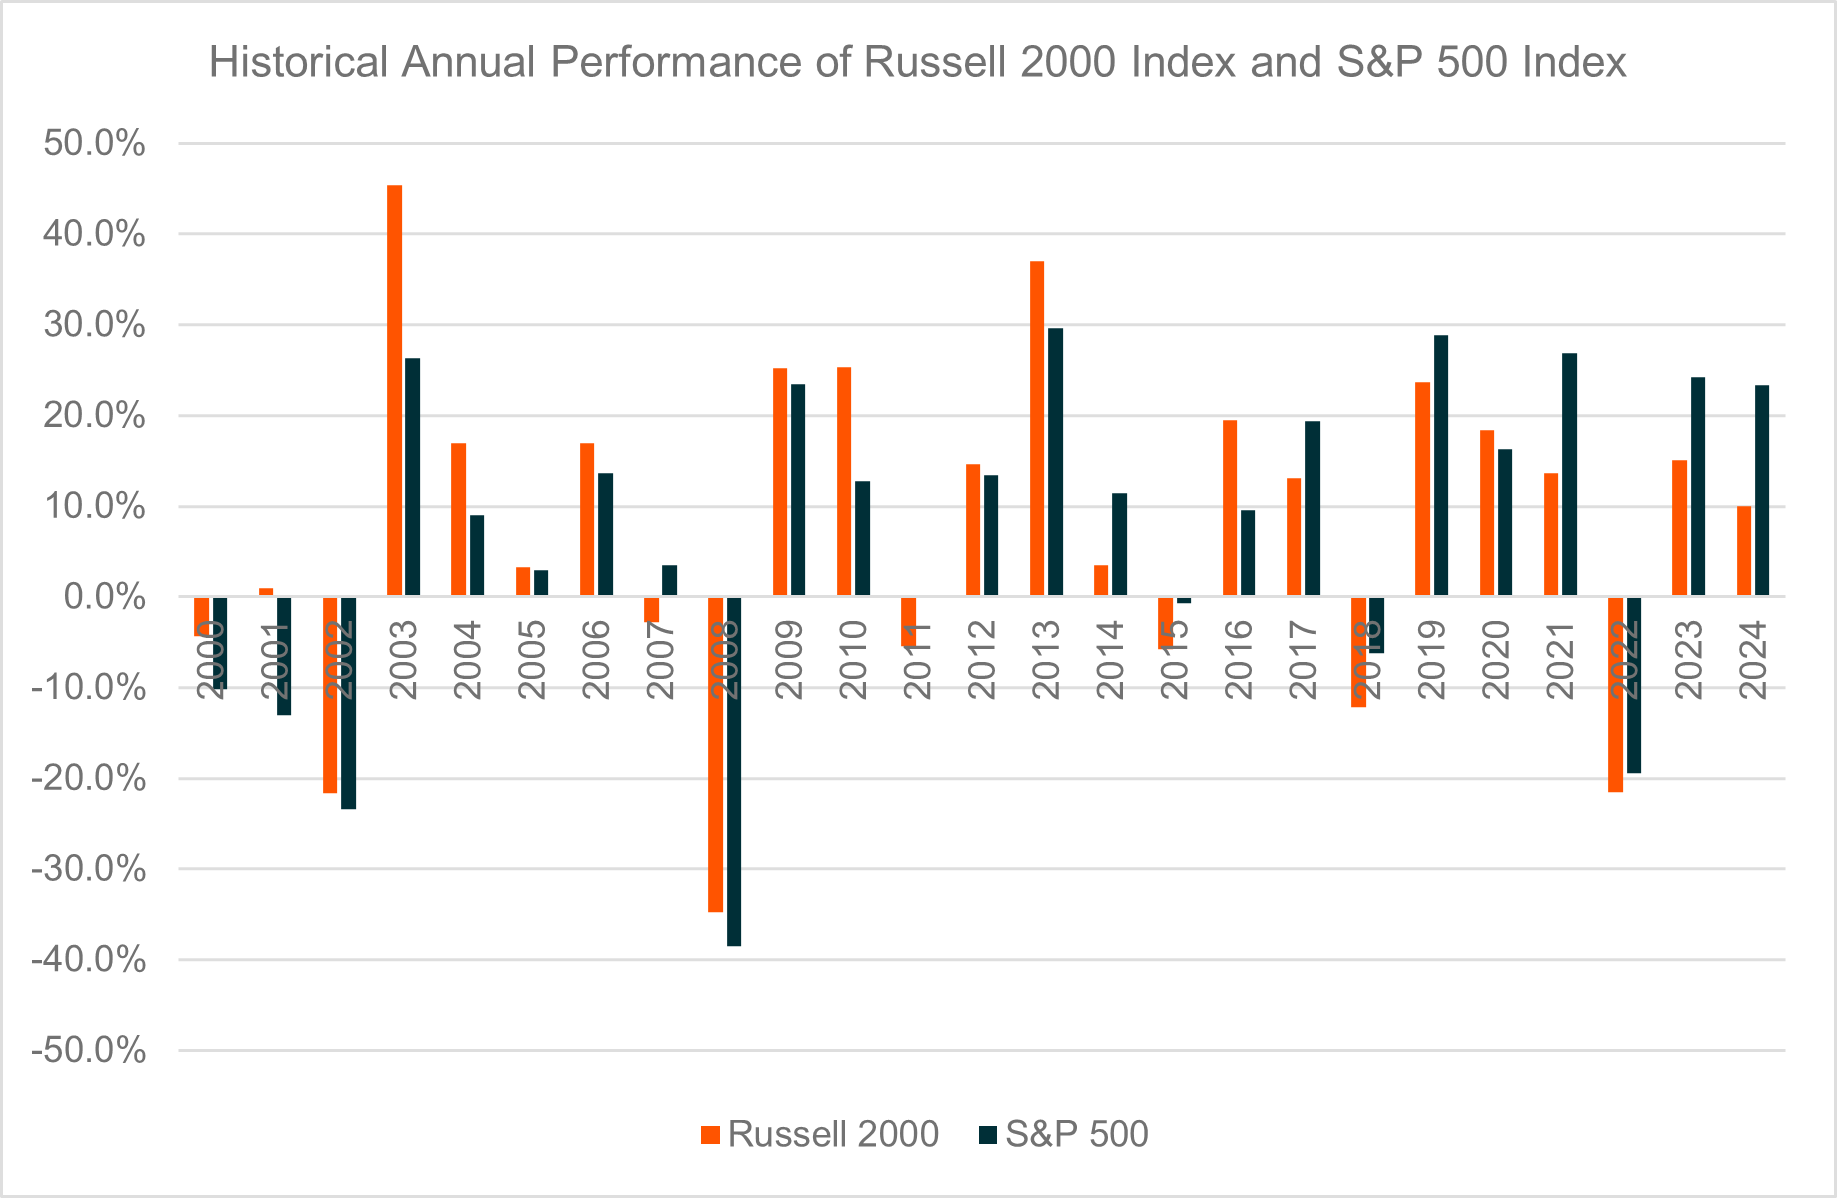
Discussion around small and mid-cap shares usually centres on the broader economic backdrop. Lower rates, easier access to capital, and a pickup in growth are commonly highlighted as factors that support Russell 2000 performance.
That relationship is well documented and widely understood by markets, which is why much of the rate-cut narrative is already priced in.
The more relevant question heading into 2026 is not whether small caps benefit from rate cuts, but what determines whether that benefit translates into sustained outperformance relative to the S&P 500. History suggests lower rates are often a necessary condition, but rarely a sufficient one. When Russell 2000 leadership has lasted, it has typically been supported by something more fundamental than policy alone.
Key takeaways
- Russell 2000 outperformance has historically been driven by earnings, rather than valuation re-rating
- Relative EPS momentum has mattered more than margin expansion or starting multiples
- The current earnings backdrop points to a potential regime shift, rather than a typical rate-cycle bounce
What tends to matter less than investors think
Small caps are frequently framed as a valuation story. They are often cheaper, more cyclical, and more sensitive to improvements in profitability, which in theory should make them natural beneficiaries of economic recoveries. In practice, many of these commonly cited factors have shown limited ability to explain Russell 2000 outperformance at the index level.
Starting valuation multiples, for example, have displayed little consistency as a signal. Stocks that appear cheap can remain cheap for extended periods, particularly when earnings visibility is uncertain. Similarly, changes in operating margins, return on equity, or dividend growth tend to move unevenly across the Russell 2000’s broad and diverse constituent base, with improvements in one segment often offset by pressure elsewhere.
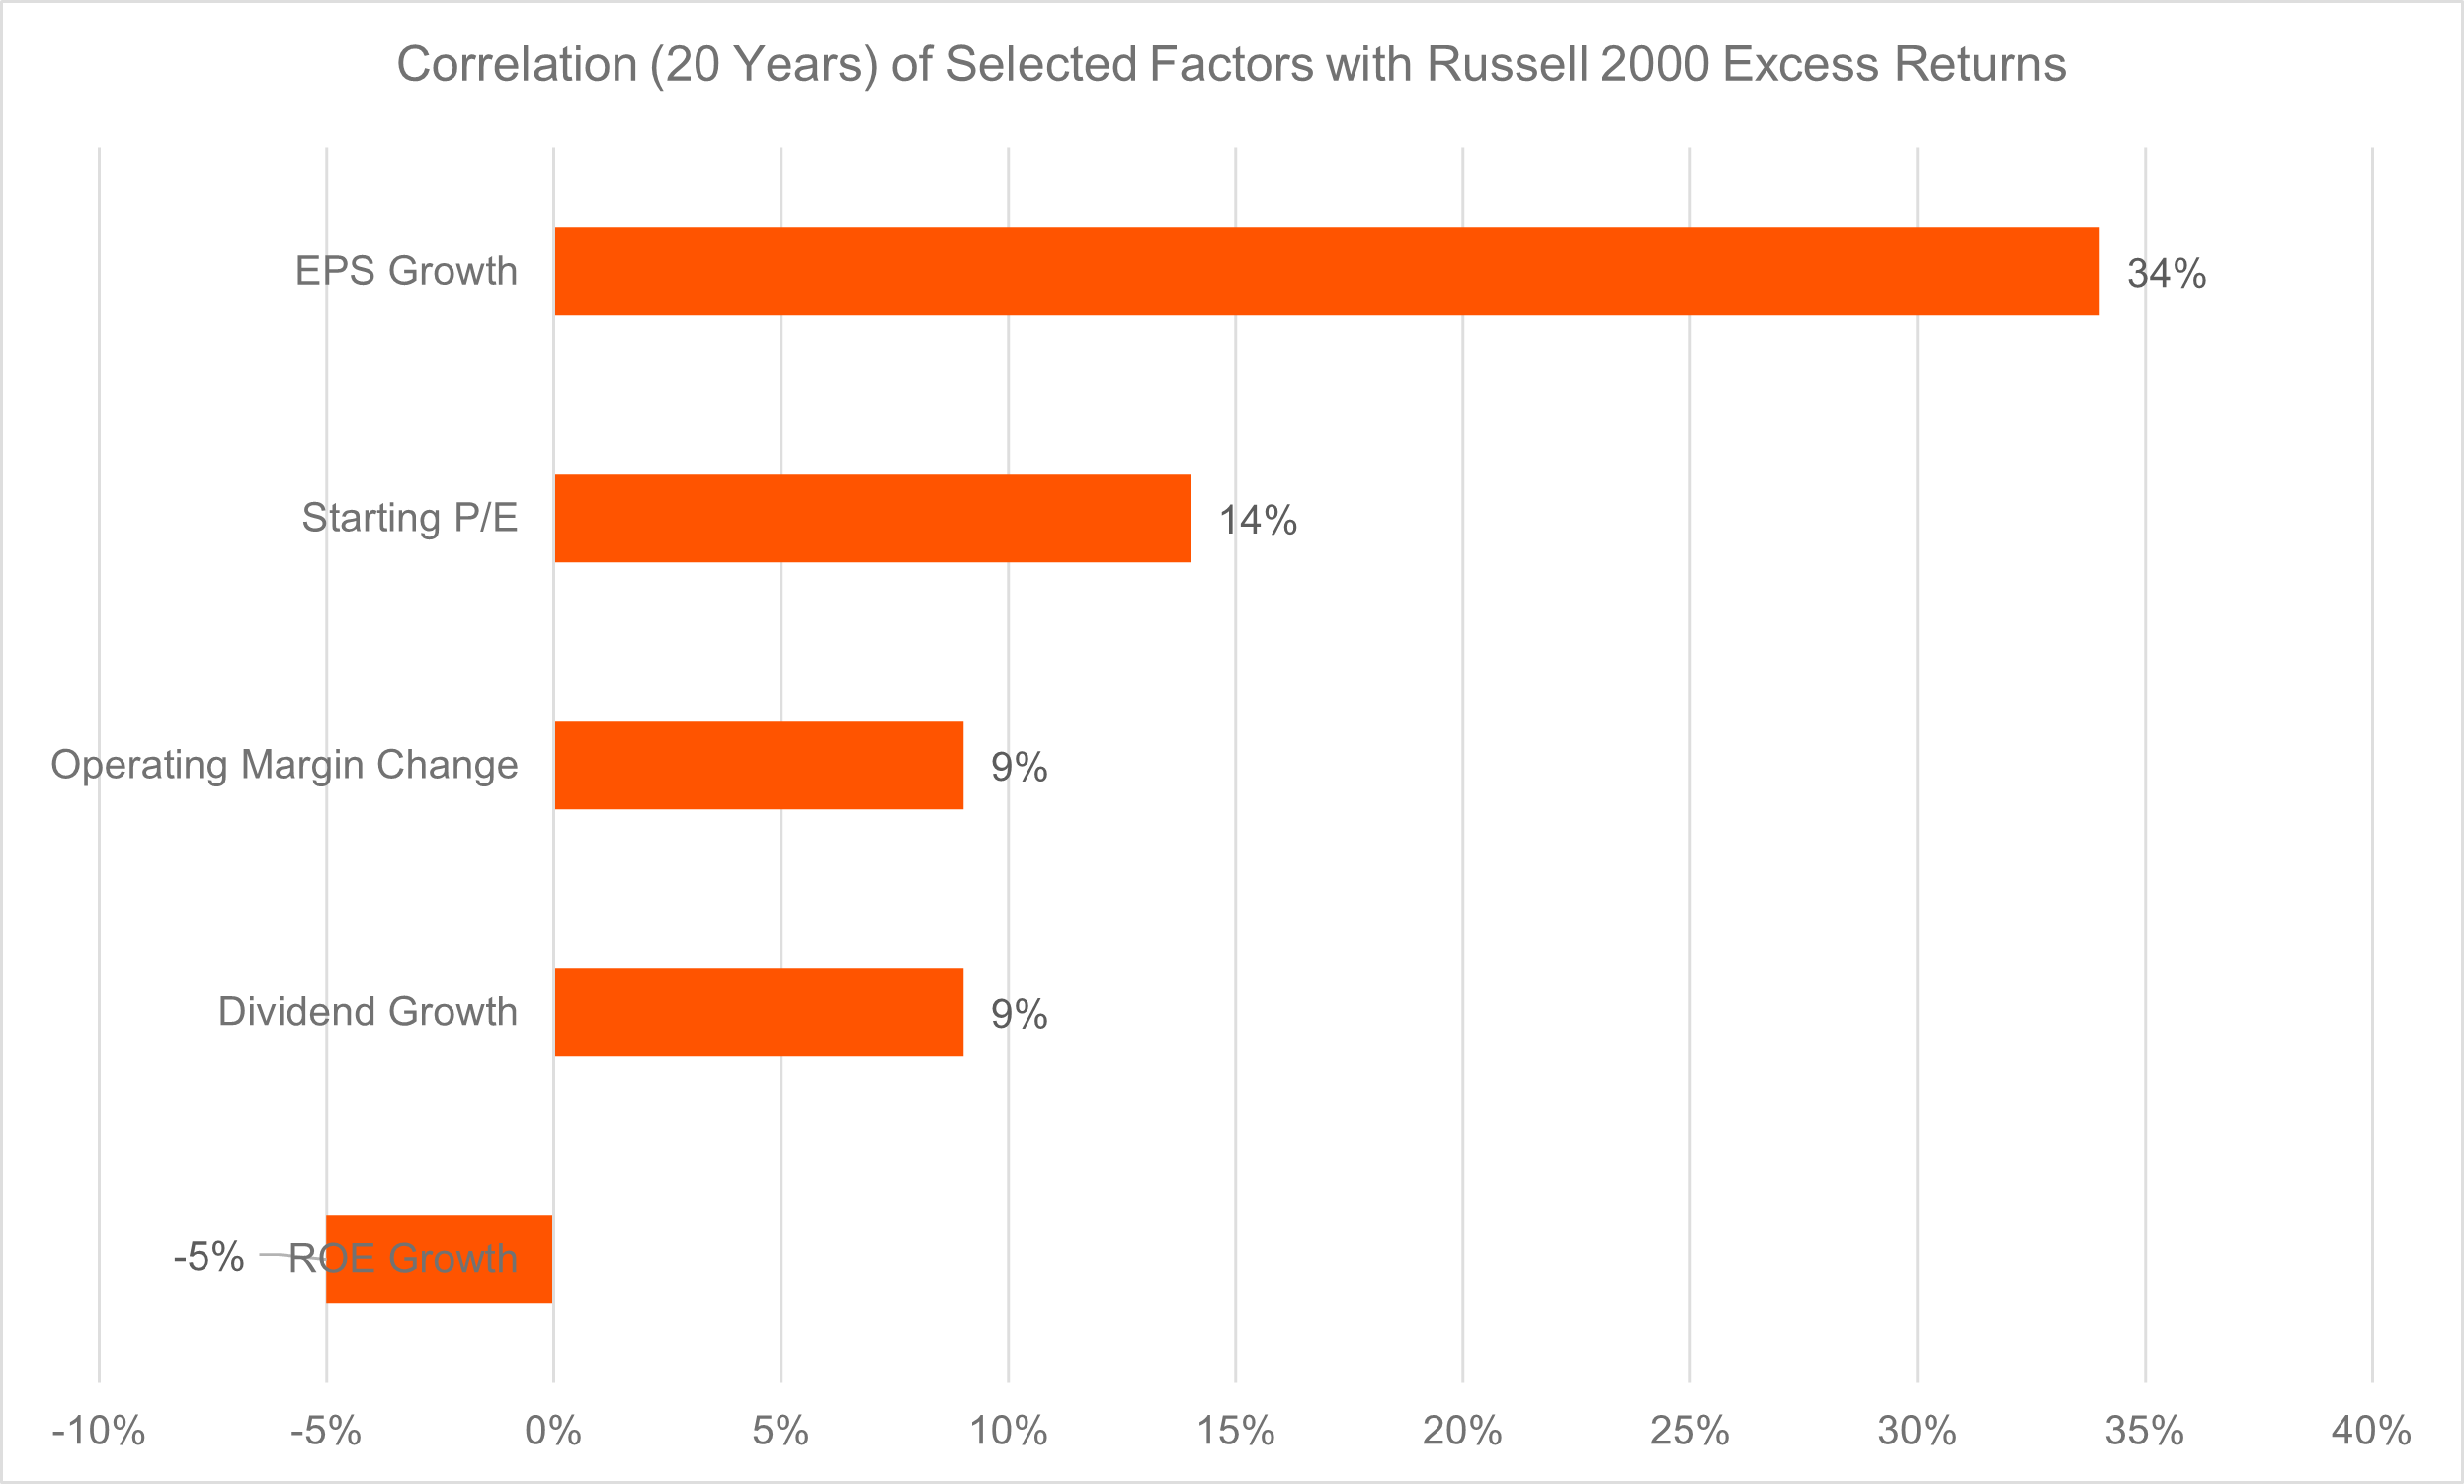
While these metrics may be useful for individual stock selection, they are blunt tools for timing index-level leadership. The Russell 2000 spans a wide range of industries, meaning slow-moving balance-sheet and profitability measures often lag turning points and show limited alignment with periods of sustained relative outperformance.
Earnings leadership as the key differentiator
What has mattered far more consistently is relative earnings growth. When Russell 2000 earnings growth has outpaced that of the S&P 500, relative outperformance has tended to follow. Importantly, small caps have not needed aggressive multiple expansion to lead. Instead, leadership has emerged when earnings growth shifted decisively in their favour.
Viewed in relative terms, this relationship strengthens further. Excess Russell EPS growth has shown a correlation of more than 50% with subsequent relative performance, compared with a 34% correlation to absolute EPS growth. This reframes the small-cap discussion away from mean reversion and toward earnings momentum.
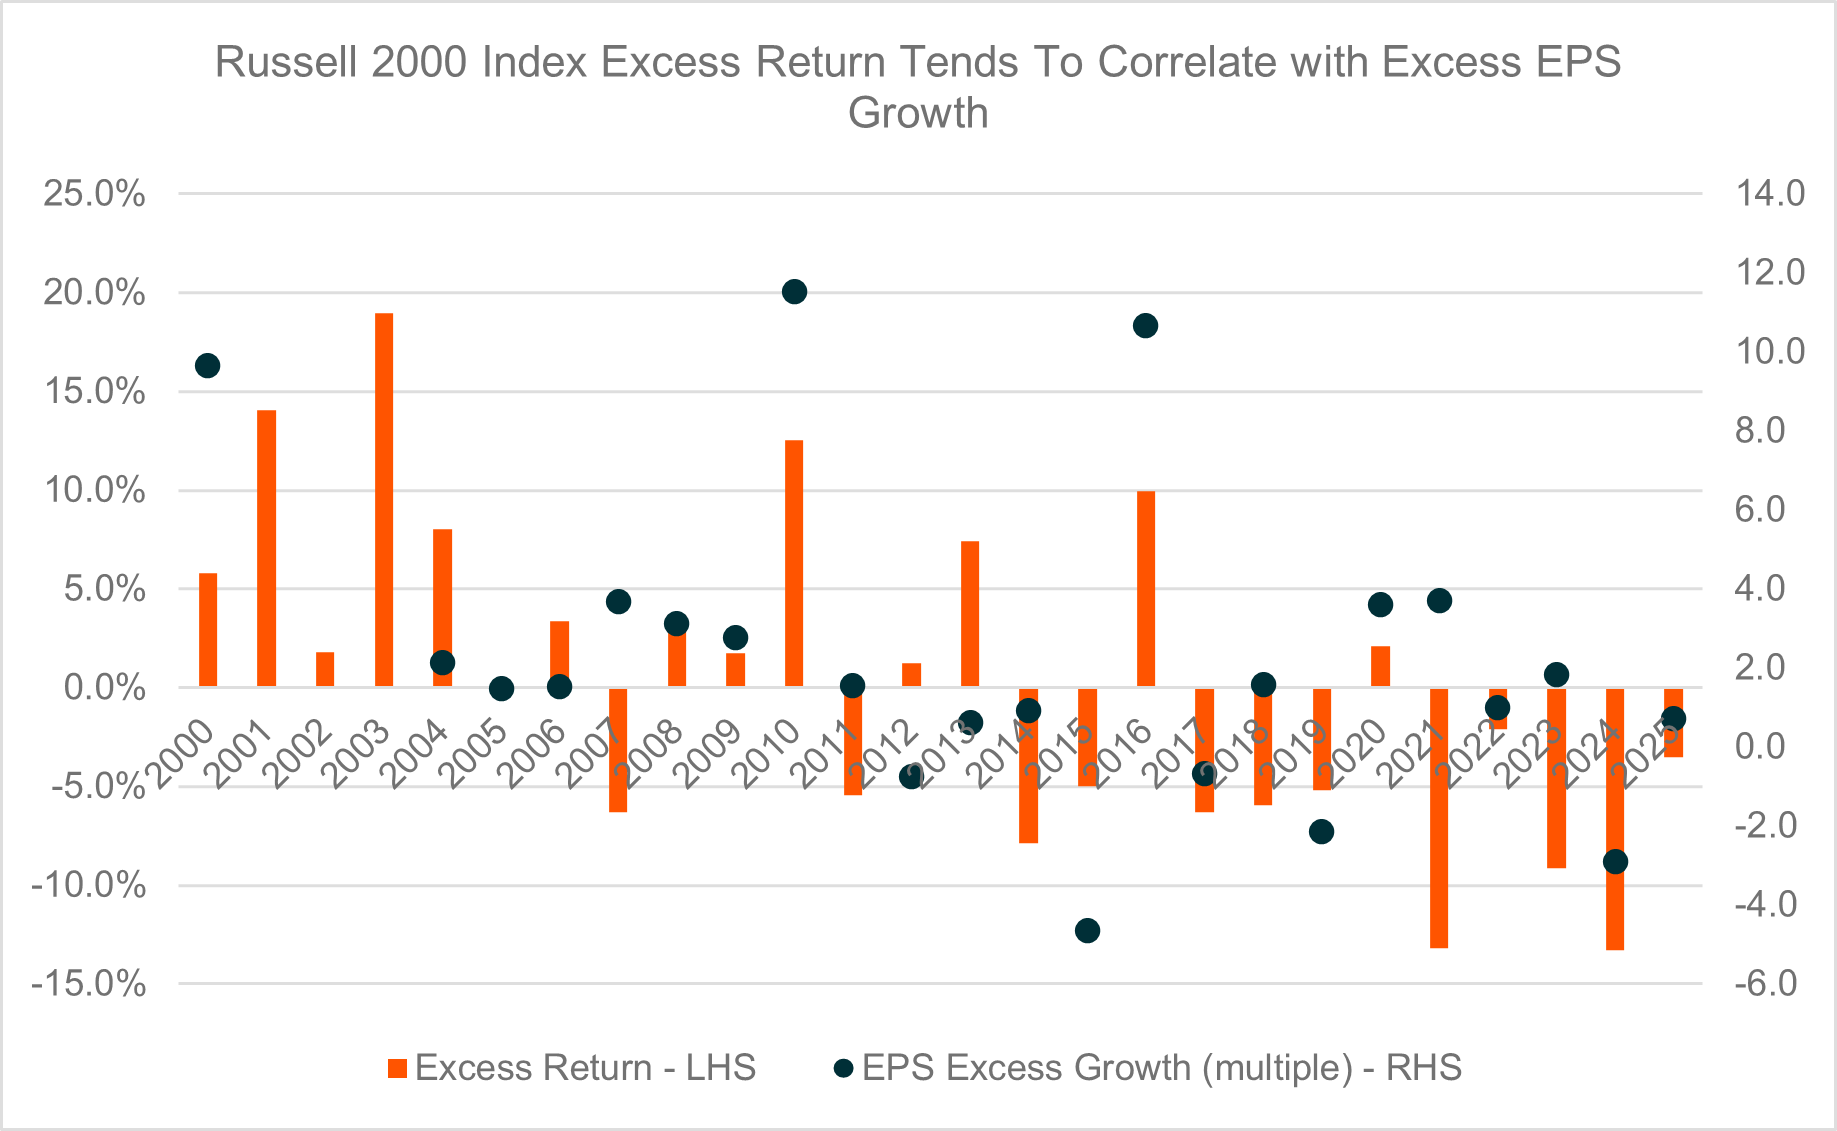
Large-cap companies dominating the S&P 500 are typically mature, globally exposed, and already operating at scale. Their earnings growth tends to be steadier, but meaningfully harder to accelerate once expectations are elevated. Small caps, by contrast, are more operationally leveraged. When revenues recover, costs are often embedded, allowing earnings to inflect more sharply.
As financial conditions ease, funding constraints can relax, reinforcing this earnings acceleration. Historically, Russell 2000 leadership has tended to emerge when this inflection becomes visible and clearly differentiated from large caps. This also explains why rate cuts alone are rarely enough. Rates may improve the backdrop, but they only translate into performance when earnings respond.
Why the current setup matters for 2026
Heading into 2026, the earnings setup looks unusual. Small-cap earnings are coming off a weaker base following a period of margin pressure, tighter financial conditions, and subdued investment. Large-cap earnings, by contrast, have already benefited from several years of strong delivery, scale advantages, and pricing power.
That divergence matters because it shifts the burden of incremental earnings acceleration disproportionately toward large caps, where expectations are already high and further growth is harder to generate. At the same time, consensus expectations for Russell 2000 earnings have begun to stabilise. Estimates further out along the curve are moving higher, even as near-term forecasts remain cautious.
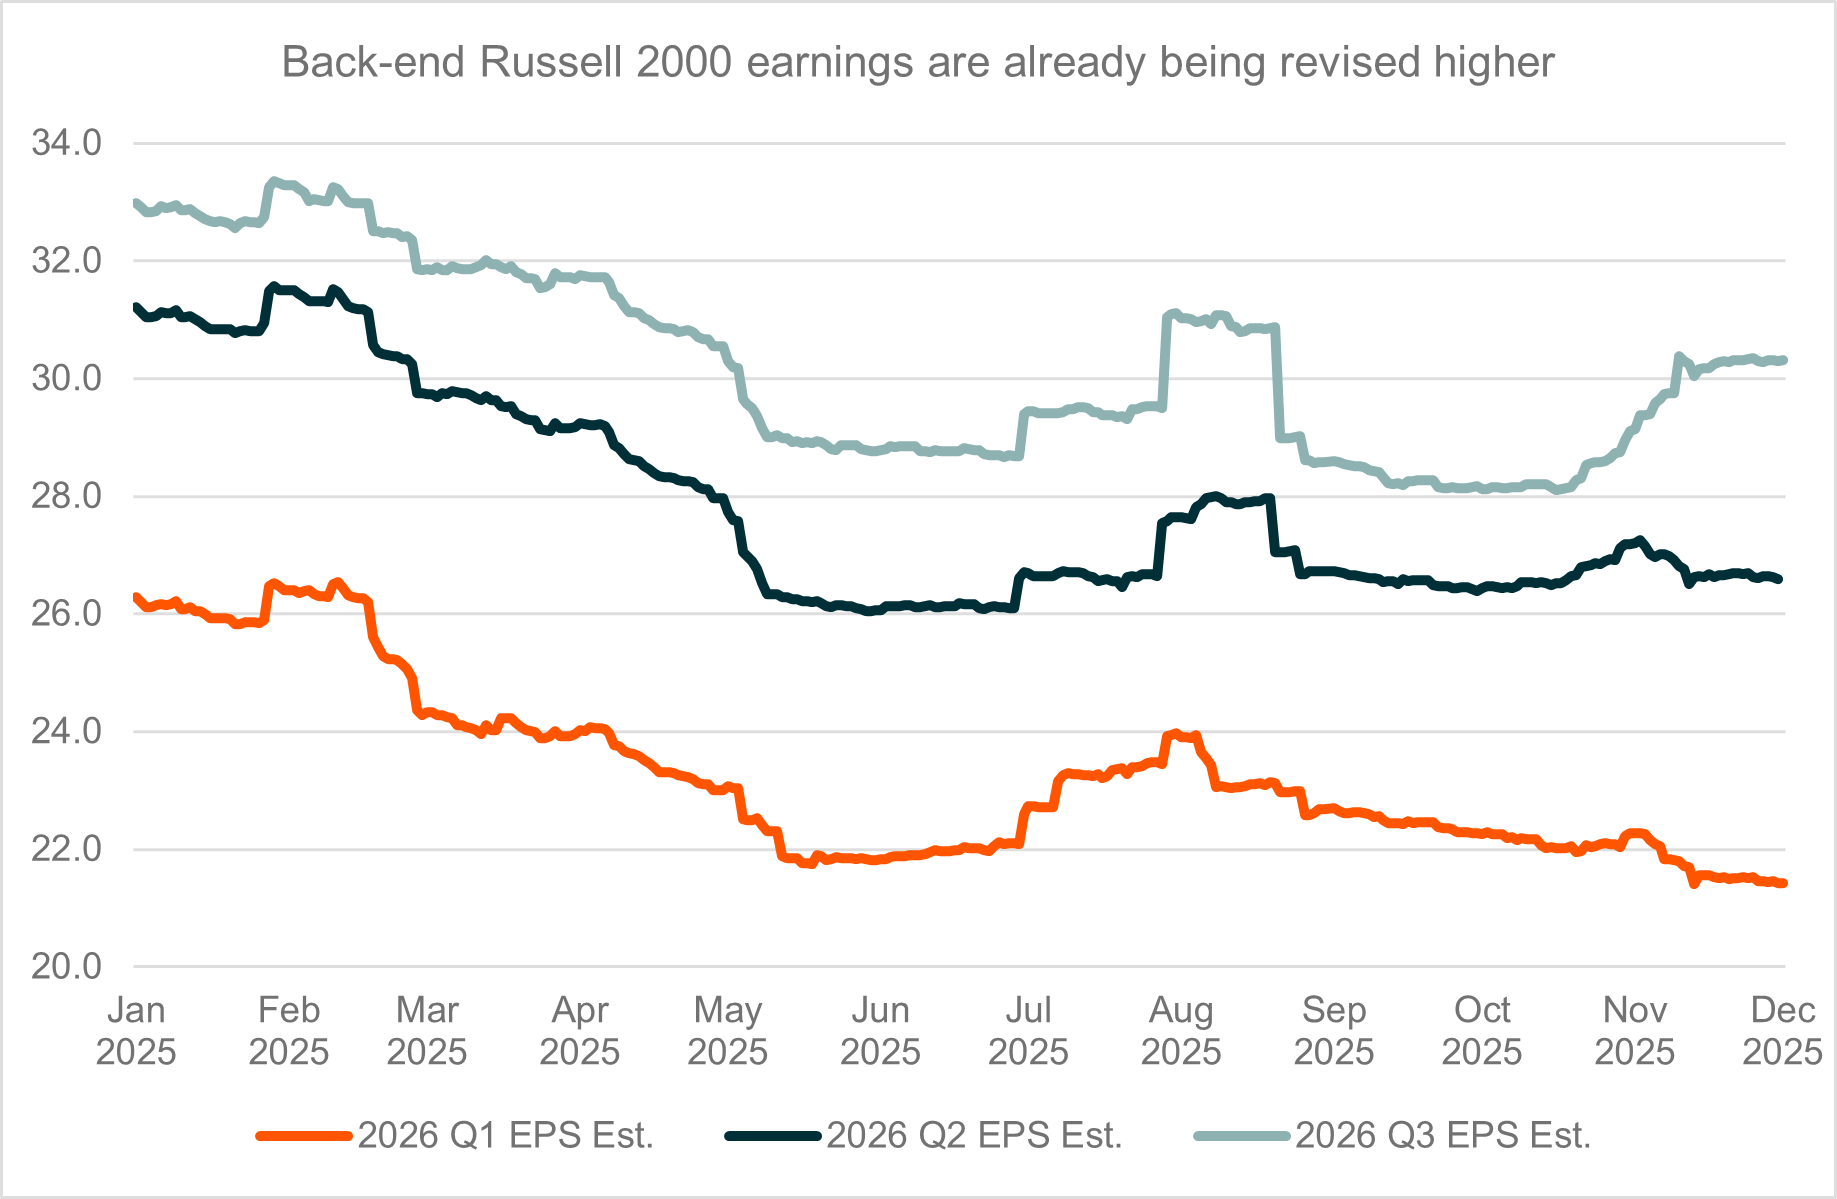
The direction of revisions suggests improving earnings visibility rather than continued deterioration. This supports the view that small-cap earnings growth could accelerate from depressed levels without relying on aggressive assumptions or a sharp change in macro conditions.
Policy settings also reinforce this backdrop. Recent US administration measures have favoured domestically oriented businesses through tax incentives, investment pull-forwards, and support for physical activity and employment. As the US approaches the mid-term phase, policy narratives have historically tilted toward visible economic outcomes rather than global platform expansion, dynamics that tend to align more closely with the Russell 2000’s domestic exposure than with the S&P 500’s global footprint.
Taken together, the current environment increasingly resembles past periods in which Russell 2000 outperformance was driven by earnings leadership rather than valuation re-rating or macro speculation.
An earnings-led setup
The Russell 2000 opportunity into 2026 is best understood as an earnings-led regime rather than a tactical rate-cut trade. History suggests that when relative earnings growth shifts decisively in favour of small caps, performance has tended to follow, even without multiple expansion or aggressive margin recovery assumptions.
If you want to check out the original article, access it here on Global X’s website.
