
So, you’ve probably heard of realised gains when it comes to investing. You know – those wins that we constantly chase but simultaneously whinge about because we have to fork out some of our (not-so) hard earned cash to pay the tax man when sold? Yeah, those.
Unrealised gains on the other hand get a little less attention. Until it comes time to sit down with a financial adviser, who is often taking a more ‘forward-looking’ and strategic view on things.
Why do we want to know your unrealised gains?
Financial advisers often want to know your unrealised gain position for several reasons:
- They’ve spotted a need to rebalance but want to know the tax implications of this before going ahead.
- Right now you’ve got a chance to put extra money into super before your balance crosses the 500k threshold. It could make sense to strategically sell some investments now while you have the capacity to offset some of the capital gains with deductible contributions.
- They’ve noted that you have some previous losses that can be absorbed to soften the tax impact, which makes this a good time to think about reshuffling things.
- Your portfolio is an absolute mess and there’s assets that need to be cleared out to make way for a stronger, more balanced mix, but they want to get a clear picture of the tax implications first before steamrolling ahead.
In short, knowing your unrealised gains helps you make smarter, proactive decisions rather than reacting blindly.
So, what exactly is an “unrealised gain”?
Essentially, it is like the profit you have on paper, but haven’t actually locked in yet. It is the increase in the share value from the date of purchase, until now, that you haven’t sold out of. For example, you buy some shares for $1,000. Later, those shares are worth $1,500. The extra $500 is your unrealised gain because you haven’t sold the shares yet.
To bring in a couple extra layers of complexity, we then need to look more closely at the ‘cost base’.
Cost base refers to the total cost for you to buy and own those shares. So, in our previous example, if the purchase price was $10 per share and you bought 100 shares, the total price paid would be $1,000. But, if you also paid $10 in brokerage then the cost base for that parcel of shares would be $1,010. Later, when you sell, the difference between what you sell it for and your cost base is your profit/ ‘capital gain’ (or loss).
Don’t Forget the 50% CGT Discount
The other important factor to consider when reviewing your unrealised gains? The eligibility to make use of the 50% CGT discount. What is this snazzy little discount? For any investment assets you own for a minimum of 12 months, the actual gain that gets added to your assessable income at tax time is typically reduced by 50%. So, coming back to our previous example, say you sell your shares for $1500 and the cost base was $1,010. This sale locks in a gain of $490. If you had owned the shares for >12 months, the amount of that sale that gets added to your assessable income for that financial year would be half of $490, i.e. $245. If your other assessable income from employment for that year totalled to $100,000, then the realised gain would bump it up to $100,245. This would be taxed at your personal marginal tax rate. Under the 2024-2025 tax rates, that would mean a marginal increase in tax payable of about $78.40. Not so bad, huh!
How do I find this info?
Generally, the most accurate way to track your capital gains is by using something like Navexa or Sharesight, which integrate with your brokerage account.
Why they’re better than your broker dashboard:
- Automatically track buys and sells, adjusting your cost base.
- Calculate realised and unrealised gains accurately.
- Generate detailed tax reports, including CGT and dividends.
- Give a clear snapshot of your portfolio’s performance, diversification, and exposure.
What really makes these so elite when compared against the overviews provided on your broker account, is that they track both buys and sells, adjusting your cost base accordingly. On the flip side, most broker accounts only reflect buy transactions in your cost base. Why does this matter? Because selling part of a holding changes your cost base for the shares you still own, which in turn affects your future capital gains calculations. Both platforms follow the default ATO method (FIFO – First In, First Out) unless you manually choose a different method. Without tools like Navexa or Sharesight, it’s easy to miscalculate your remaining cost base, which could lead to overpaying or underreporting capital gains when you eventually sell.
What if I don’t have a third party tool like Navexa or Sharesight?
If you’re looking for a general view on your capital gain/loss position, without digging too deep into the true cost base position, you can usually find a snapshot of this on your brokerage account. Where exactly? Well, it’s typically not the most easily accessible info on a broker platform, and it varies from one broker to another. But we’ve summarised the whereabouts for a few of the most commonly used brokers.
Pearler
Pearler provides a summary of your cost base for each holding within the platform. It doesn’t however offer a detailed unrealised gains report within the platform (like many). To get more detailed insights, including capital gains and tax implications, Pearler integrates with Sharesight – you can find more info on that here.
Although there is no consolidated report t you can generate directly from Pearler, you can find all the info you need on your Dashboard for each asset:
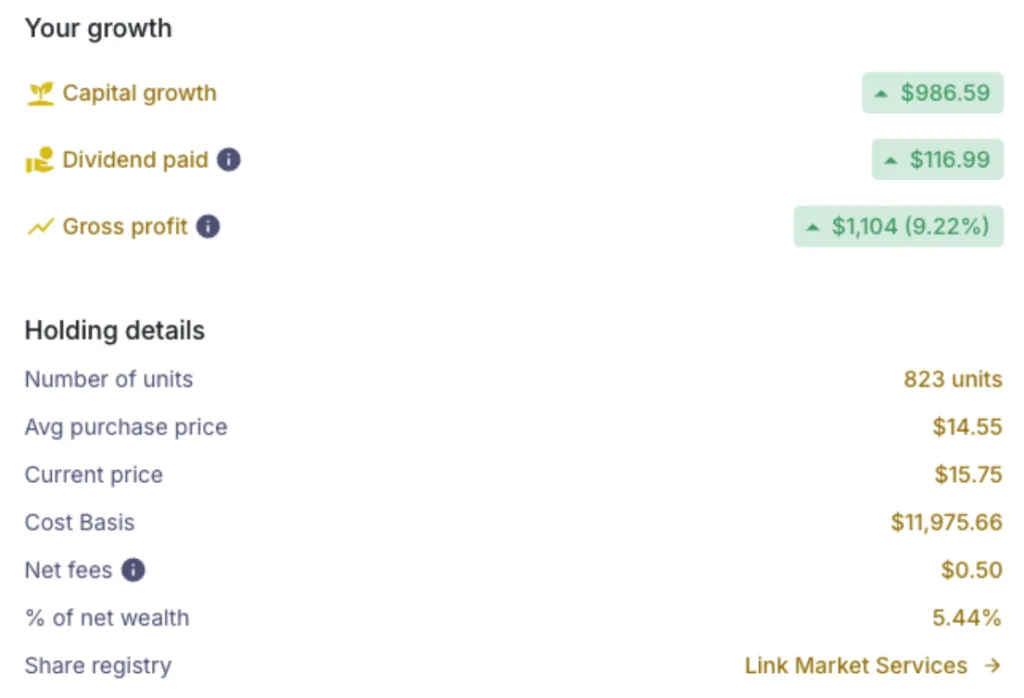
The capital growth figure in the above image is calculated as the current market value less the cost base. So essentially, this is your unrealised gain position on that individual asset. You will however need to track the timelines on your purchases to note when particular parcels become eligible for the 50% discounting, particularly if you are regularly re-investing into that same asset. There may be some parcels that are eligible for the discount, and other more recent acquisitions that are not (this is where Sharesight becomes so useful!).
CMC
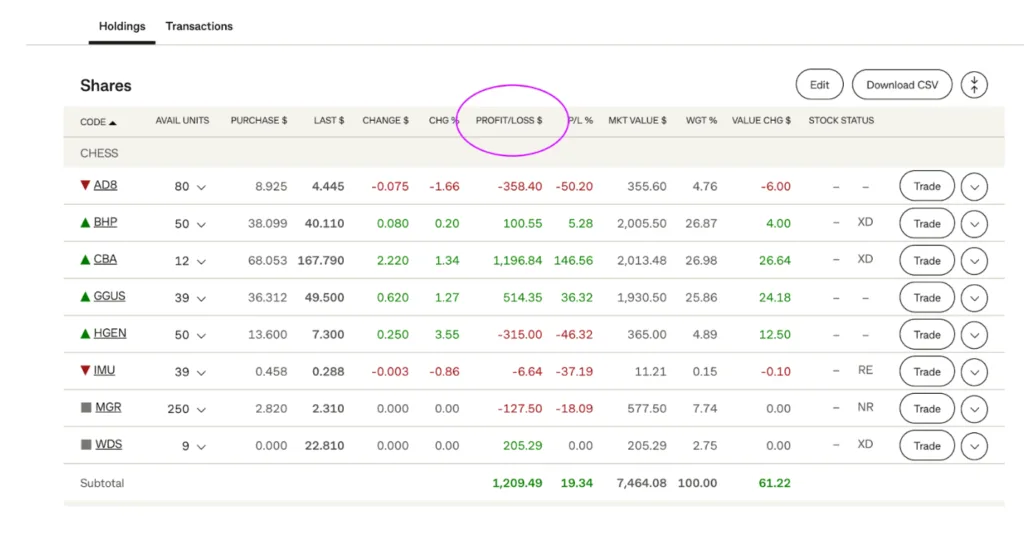
On CMC you can also view your cost base and unrealised in your account for each asset individually. If you’re using the web based CMC, navigate to “holdings”. From here, select “profit & loss” to view the cost base and unrealised gains for each holding. CMC also allows you to download portfolio statements in CSV or PDF format which also show cost base and unrealised gains. Just make sure you cross check these and keep tabs on your transaction history to cross check buys/sells and any DRPs or corporate actions against the average price shown. Alternatively, let Sharesight do the heavy lifting! CMC also integrates with Sharesight, and you can generate detailed reports on all your portfolio movements to make tax time a breeze.
Commsec
To locate your cost base and unrealised gain/loss info on CommSec, you can find some indicative numbers from your dashboard. After logging in, navigate to “portfolio” then click into the “holdings” button. This will take you to a table which lists all your holdings, and a column labelled “Purchase $”. This is the average purchase price for all parcels bought of that particular asset, including brokerage. Importantly, this doesn’t account for any sales of units for that particular holding, but it gives you a rough indication. The “profit/loss $” column is simply the most recent share price, less the average cost price, multiplied by the number of units held. To get the most accurate figures for tax reporting, your accountant might like to see the transaction records. This will show all purchases and sales, so they can reconcile these and land on the correct cost base for units being sold.
SelfWealth
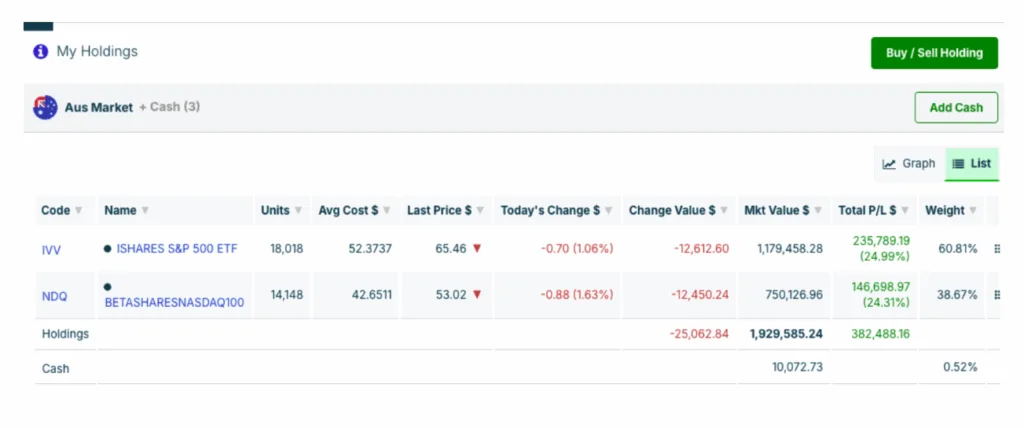
Similar to each of the above, you can locate a rough indication of your unrealised gains on SelfWealth by navigating to your portfolio and viewing the average cost and the last price columns, and multiplying the difference by the units held.
Are these numbers ‘enough’ for accurate tax reporting?
The average cost price vs market value figures you see in platforms like CommSec, CMC, or SelfWealth are useful for a quick snapshot of performance, and a rough indication of your gain/loss positions. But, they’re not sufficient or reliable enough for tax purposes on their own. Here’s why:
- Adjustments aren’t always included: Brokerage fees, DRPs (dividend reinvestment plans), corporate actions (splits, consolidations, takeovers, demergers) may not be fully factored into the “average cost price” calculation.
- Different parcels matter: For CGT, you can use methods like FIFO (first-in, first-out) or specific parcel selection. The “average” shown in a platform ignores that choice.
- Accountants need detail: To calculate an accurate cost base and realised gains, your accountant will usually need a full transaction history export (CSV/PDF) showing each buy, sell, DRP, and associated cost.
- Unrealised gain/loss reports are only estimates, and may not match the ATO’s calculation without those details.
That’s why we typically prefer to see the Navexa or Sharesight reporting. These build an accurate cost base ledger accounting for all the adjustments along the way. Alternatively, accountants or advisers might like to see the transaction history spreadsheet, and then they (or software like Sharesight or Navexa) can build an accurate cost base ledger for CGT reporting.
In short?
At the end of the day, keeping an eye on your unrealised gains isn’t just about knowing how much ‘profit on paper’ you’re sitting on. It’s about being prepared to make smarter, more strategic and proactive decisions with your investments. Whether you’re thinking about rebalancing, planning ahead for tax time, or simply wanting a clearer picture of where you stand, understanding cost base and unrealised gains/losses puts you in the driver’s seat. And when it comes time to actually realise those gains, you’ll be far better equipped to do so with confidence (and without cheeky surprises from the tax office).