

In recent years, the financial world has been swept up in an acronym frenzy.
From the latest ‘Magnificent 7’, comprising powerhouses including Microsoft Corp (NASDAQ: MSFT), Apple Inc (NASDAQ: AAPL), Alphabet Inc Class C (NASDAQ: GOOG), Meta Platforms Inc (NASDAQ: META), Tesla Inc (NASDAQ: TSLA), Amazon.com Inc (NASDAQ: AMZN), and NVIDIA Corp (NASDAQ: NVDA), to variations like FAANG [the ‘N’ represents Netflix Inc (NASDAQ: NFLX)], MAGMA, and MAMAA, these acronyms represent market darlings in moments of time.
Even in Australia, we’ve had our own version with the ‘WAAAX’ – WiseTech Global Ltd (ASX: WTC), Altium Ltd (ASX: ALU), Afterpay Ltd (ASX: APT), Appen Ltd (ASX: APX), and Xero Ltd (ASX: XRO).
But the media’s love affair with their meteoric rise can mask a hidden risk:
What goes up, doesn’t always stay up.
Even within these seemingly invincible acronyms, companies can falter or simply fall out of favour due to factors such as disruption, mismanagement, or poor execution.
In this blog, we explore how today’s most buzzworthy investment choice can become tomorrow’s cautionary tale, and share some ETF ideas that can help investors navigate market shifts without getting burned by a single stock’s stumble or an entire acronym’s downfall.
The trend trap
During a rising market, when everything seems to be trending up and certain companies are taking off due to a novel idea or theme, it’s tempting to believe that this time is different.
But it’s precisely during times of exuberance that the allure of quick gains can overshadow prudent investing.
Lessons from the past: GE, Appen, BRIC
History is littered with the wreckage of once-unstoppable companies that were idolised by many investors at the time.
Consider General Electric Co (NYSE: GE), which fell victim to its own poorly timed acquisitions and unsustainable debt, forcing it to split. Its fall from grace as once the world’s largest conglomerate was marked by its expulsion in 2018 from the Dow Jones Industrial Average (INDEXDJX: .DJI) of America’s 30 most significant businesses.
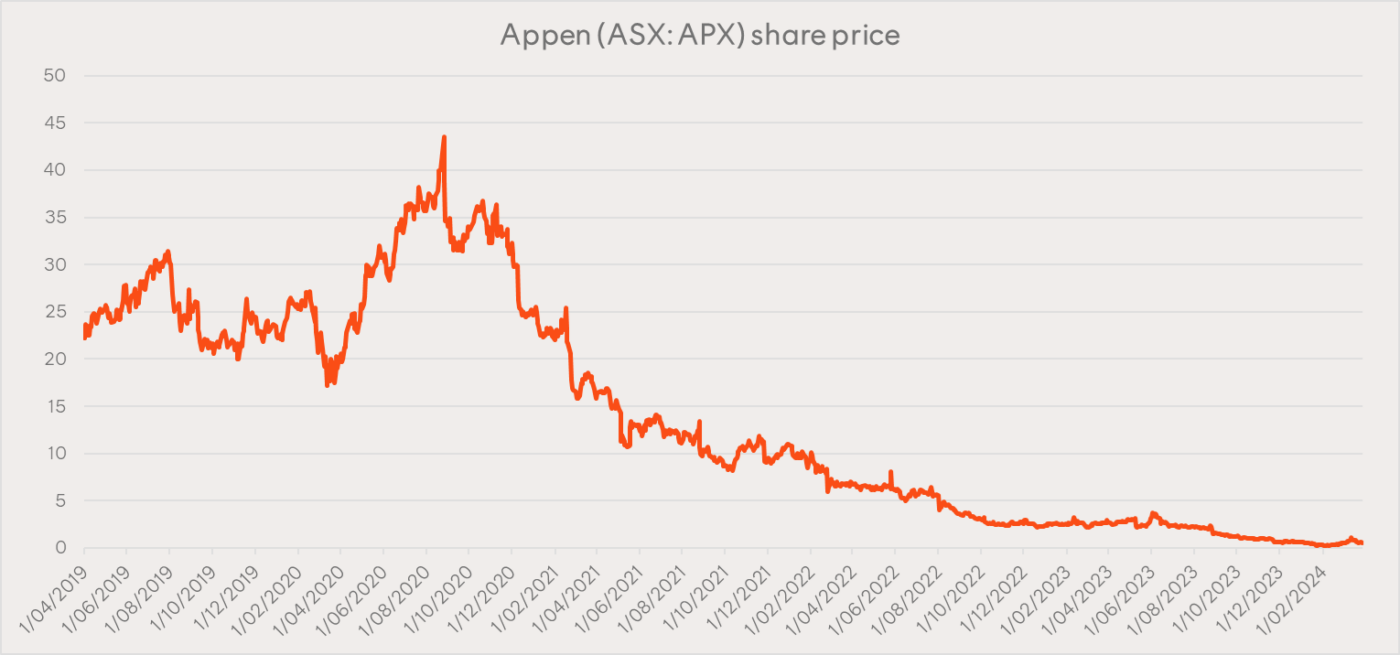
Closer to home, Appen has lost nearly 99% of its value as its over-reliance on a few large clients led to its fall from grace. Appen was removed from the S&P/ASX 200 (INDEXASX: XJO) in 2022.
It’s not just individual companies that can fall victim to overhyped trends.
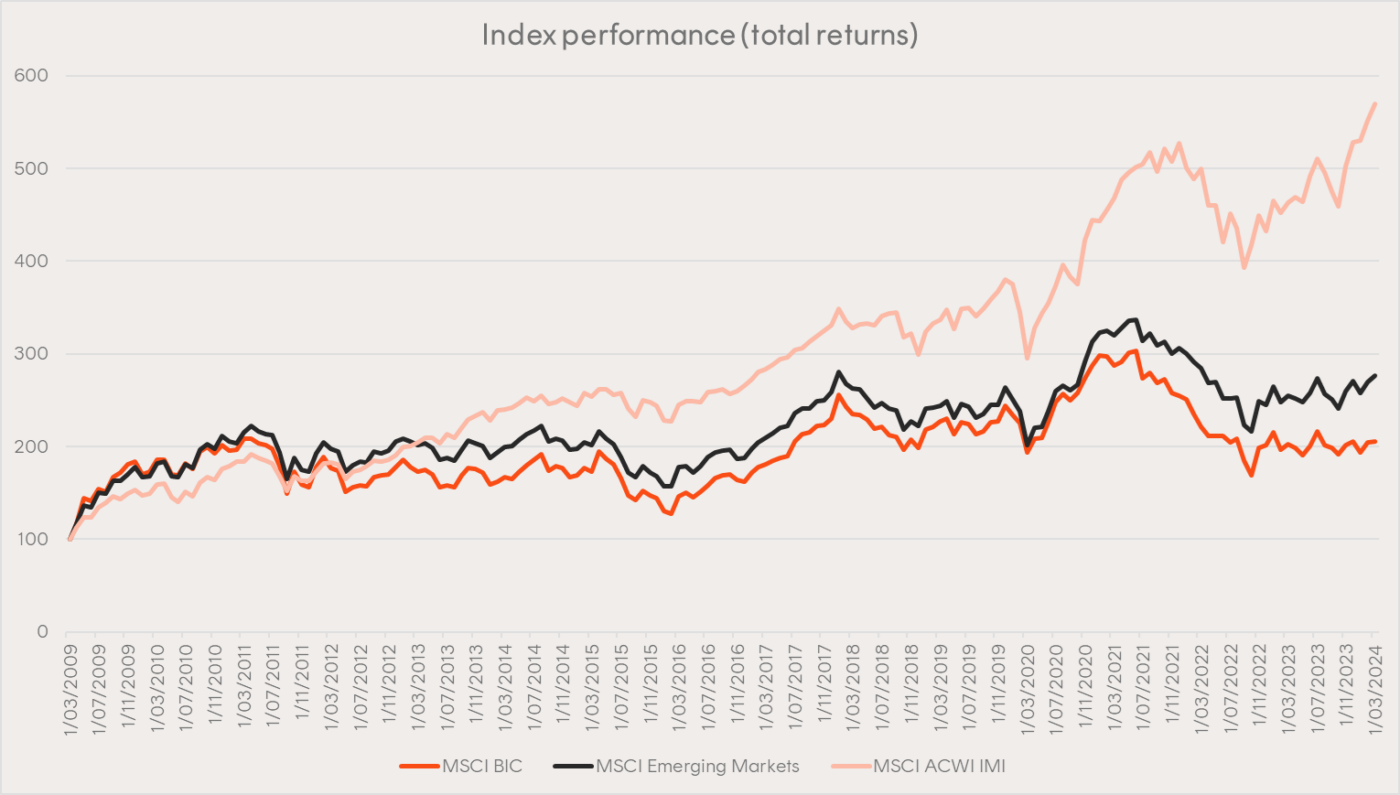
Remember the BRICs (Brazil, Russia, India, China)?
This catchy acronym once represented the hottest emerging markets, dazzling investors with their brief, initial outperformance (see chart below).
However, the allure of the story overshadowed key risks like political instability and challenging economic fundamentals in developing nations.
China’s slowdown, Brazil’s political turmoil, and the mass exodus from Russian assets due to Russia’s illegal war in Ukraine exposed the dangers of overexposure to specific emerging economies. The once-mighty BRICs have now become the “BICs,” delivering subpar returns compared to the broader global and emerging markets.
Today’s trending acronyms: Magnificent 7, FAANG, MAGMA, MAMAA
Facebook, Alphabet, Meta, Amazon, Microsoft, Nvidia, Netflix and Tesla have contributed to a significant portion of the growth in the Nasdaq-100 (INDEXNASDAQ: NDX) and S&P 500 (INDEXSP: .INX) indices over the last decade.
Bundling them together into a memorable acronym and focusing on past performance makes them seem like a sound investment thesis, but going all-in on the tech behemoths can expose investors to undue risk and volatility.
Just as BRIC obscured the differences in the economies in the constituent countries, FAANG and its variants can mask significant differences in the performance of individual stocks, as shown in the chart below.
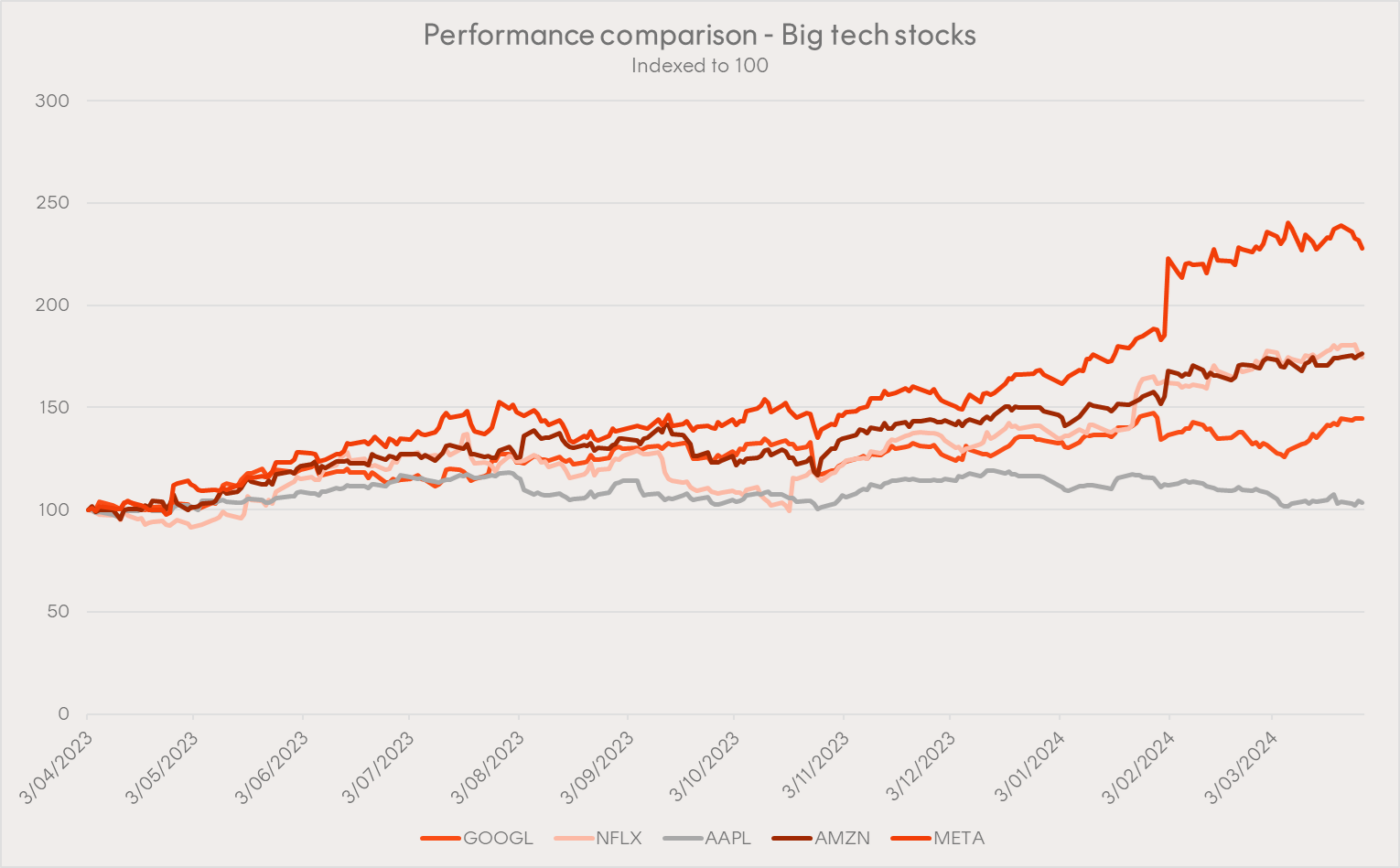
Although focusing on a short period of time, the performance of the FAANG companies for the last 12 months illustrates significant divergence between them, with Apple gaining just 3.2%, while Meta soared over 120%. Netflix, bumped out of the FAANG club in favour of Microsoft to form MAGMA or MAMAA, is experiencing a resurgence and outperforming Microsoft, Amazon, and Alphabet.
These unexpected outcomes illustrate that investing in one or a few of these equities exposes investors to volatility, unpredictability, and the potential to wipe out gains in dramatic twists and turns.
What can we learn?
While it’s true that historically, these companies have made substantial contributions to index returns, it’s equally undeniable that it’s impossible to predict when companies are past their prime.
The data speaks volumes.
Since 2015, nearly a third (around 180 companies) of the S&P 500 constituents have been replaced4, often due to economic shifts, disruption, poor management, or acquisitions by larger rivals.
Furthermore, the tables below show how radically different the list of the world’s largest companies has become since 2000, compared to recent history.
Largest companies by market capitalisation (1 January 2000)
| Rank | Company | Market cap (1 January 2000) |
| 1 | Microsoft | US$606 billion |
| 2 | General Electric | US$508 billion |
| 3 | NTT Docomo | US$365 billion |
| 4 | Cisco | US$352 billion |
| 5 | Walmart | US$302 billion |
| 6 | Intel | US$280 billion |
| 7 | Nippon Telegraph | US$271 billion |
| 8 | Nokia | US$219 billion |
| 9 | Pfizer | US$206 billion |
| 10 | Deutsche Telekom | US$197 billion |
Largest companies by market capitalisation (1 July 2022)
| Rank | Company | Market cap (1 July 2022) |
| 1 | Saudi Aramco | US$2.27 trillion |
| 2 | Apple | US$2.25 trillion |
| 3 | Microsoft | US$1.94 trillion |
| 4 | Alphabet | US$1.43 trillion |
| 5 | Amazon | US$1.11 trillion |
| 6 | Tesla | US$707 billion |
| 7 | Berkshire Hathaway | US$612 billion |
| 8 | United Health Group | US$485 billion |
| 9 | Johnson & Johnson | US$472 billion |
| 10 | Tencent | US$435 billion |
Source: Visual Capitalist, Betashares
This is where considering ETFs that track entire markets and sectors, or invest in securities with defined criteria, makes sense:
- Built-in diversification: No need to stress over choosing individual winners. Index-tracking ETFs spread your investment across a range of companies, making diversification easier and reducing your exposure to any single company’s setbacks.
- Automatic rebalancing: Indexes aren’t static. As companies fluctuate within the index, underperformers are regularly swapped out for stronger contenders. This ensures your portfolio remains aligned with the economy’s evolution.
- Long-term focus: Index funds aren’t swayed by short-lived trends. They aim to track the overall market or companies (before fees and expenses) that meet defined criteria, capturing growth across various industries and sectors. This approach helps you weather the inevitable ups and downs of the market.
ETFs for a well-diversified portfolio, with growth potential
Now that we’ve explored the potential pitfalls of falling for trendy acronyms, let’s delve into ETF ideas that offer both diversification and growth potential:
BetaShares S&P 500 Equal Weight ETF
BetaShares S&P 500 Equal Weight ETF (ASX: QUS) offers investors exposure to 500 leading listed US companies, including the Magnificent 7 stocks, with equal weighting across all holdings, rebalanced quarterly.
This means that each stock within the portfolio receives an equal investment allocation, whether it’s a tech giant like Microsoft or NVIDIA, or a consumer goods company like Lululemon or Procter & Gamble.
As a result of this equal weighting approach, QUS provides a diversified portfolio of US stocks while avoiding over-reliance on a few narrative-dominating companies or the technology sector.
Betashares Australian Quality ETF
Rather than investing in companies based on size, Betashares Australian Quality ETF (ASX: AQLT) screens for Australian stocks based on ‘quality’ metrics of high return on equity, low leverage, and relative earnings stability. As at 3 March 2024, its top holdings include BHP Group Ltd (ASX: BHP), CSL Ltd (ASX: CSL) and Commonwealth Bank of Australia (ASX: CBA).
As a result, investors gain access to a portfolio of quality Australian companies, offering potential portfolio diversification benefits.
Nasdaq Next Gen 100 ETF
Some growth investors aim to identify and access tomorrow’s potential FAANG and MAGMA equivalents, without shouldering the individual stock risk or the complexities of pinpointing which small company might evolve into the next NVIDIA.
Nasdaq Next Gen 100 ETF (ASX: JNDQ) aims to track the Nasdaq Next Generation 100 Index (before fees and expenses), comprising companies in the relatively early stages of their development that have the potential to emerge as future leaders across various sectors, including technology, industrials and healthcare.
Betashares Asia Technology Tigers ETF
While the focus of the technology narrative often centres on the American-centric Magnificent 7, it’s crucial to recognise the significant role played by Asian firms such as chipmakers Samsung Electronics Co Ltd (KRX: 005930) and Taiwan Semiconductor Manufacturng Co Ltd (TPE: 2330), in shaping the global AI landscape.
Betashares Asia Technology Tigers ETF (ASX: ASIA) offers investors exposure to this vital backbone by investing in the region’s 50 largest technology and online retails stocks. As such, this ETF can serve as a compelling complement to US technology stocks, providing a well-rounded approach that includes exposure to AI, digital commerce and consulting services.
Conclusion
By embracing index investing through ETFs, you can gain exposure to narrative-dominating securities like ‘FAANG’ and ‘WAAAX’ within the context of a well-diversified portfolio.
This means you can enjoy the benefits of these market leaders without the stress of individual stock risk.
Moreover, should an acronym lose its appeal, a large company encounters mismanagement, or economic changes spark new innovations, indexes will automatically rebalance.
This ensures that your portfolio stays aligned with the evolving market landscape, as new market leaders are added, and underperforming companies are removed.


