
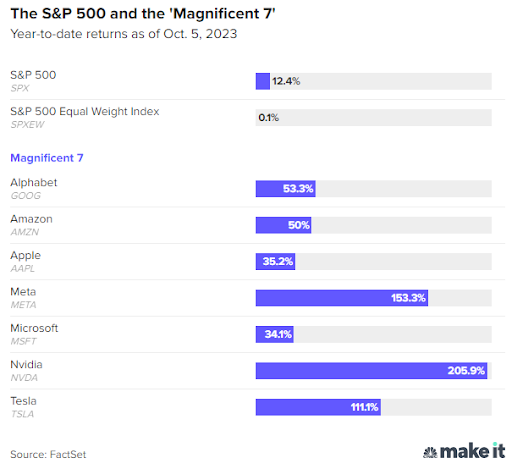
The U.S.-listed technology giants have been long-time investor favourites, and with good reason–they have dominant businesses with large addressable markets and incredible financial metrics. They have also been responsible for the overwhelming majority of the S&P 500’s (INDEXSP: .INX) returns this year.
According to CNBC, the ‘Magnificent 7’ as they are now known (replacing previous nicknames such as FAANG and FANGMA) have returned 92% on average through October 5, 2023.
With the third quarter earnings season unfolding, investor expectations are high and the results will need to be strong to sustain such a rally.
All numbers below are in U.S. Dollars unless noted otherwise.
Alphabet
Despite the sharemarket punishing the share price on the release of its results, Alphabet Inc Class A (NASDAQ: GOOGL) and Alphabet Inc Class C (NASDAQ: GOOG) reported a revenue increase of 11% year-on-year (YoY) while earnings per share (EPS) rose 46% YoY to $1.55.
Alphabet share price
Digital advertising had gone through a tough period at the end of 2022 and early in 2023, and shareholders were pleased to see Google advertising revenue increase 9.5% YoY to $59.6 billion. This included an 11% YoY increase for the company’s most important segment, Google search, a 12% YoY increase for YouTube ads and a slower decline of 3% YoY for Google Network.
Google Cloud Platform (GCP) revenue rose 22% YoY to $8.4 billion and generated $266 million in operating income–delivering its first meaningful quarter of profitability after surpassing breakeven last quarter. Other Bets revenue increased 42% to $297 million but remained a sore point for profitability, with an operating loss of $1.2 billion.
CEO Sundar Pichai highlighted the company’s focus on artificial intelligence (AI), describing it as a “foundational platform” shift.
The other focus was costs, with revenue increasing (11% YoY) at a faster pace than costs (6% YoY).
Impressively, CFO Ruth Porat believes that the company should achieve operating leverage once again in 2024. Share repurchases remained robust at $15.8 billion ($43.9 billion year-to-date) without any impact on the pristine balance sheet, which had approximately $120 billion in cash and securities at the end of the quarter.
Meta Platforms
Meta Platforms Inc (NASDAQ: META) also benefited from the industry rebound in digital advertising, with revenue rising 23% YoY to $34.1 billion. As well as the benefits from AI-enabled targeting, the quarter compared to a particularly tough period in 2022 following the privacy changes implemented by Apple Inc (NASDAQ: AAPL). Breaking it down, revenue was boosted by a 31% YoY increase in ad impressions while average ad pricing decreased 6% YoY.
Apple share price
Net profit rocketed 164% higher YoY, reflecting both the strong revenue performance and the benefits of the cost savings initiatives over the last twelve months. The whipsawing share price performance over the last couple of years reflects the challenges from Apple’s privacy policies as well as concerns over spending, including excessive hiring during the pandemic and Mark Zuckerberg’s visionary spending on the Metaverse. On this front, Meta’s Reality Labs business unit lost $3.7 billion during the quarter.
Despite the strong financial performance, capital return was modest with just $3.7 billion in buybacks despite approximately $42 billion in net cash. Importantly, daily active people (DAP) across Meta’s family of apps (Facebook, Instagram and WhatsApp grew 7% YoY to a staggering 3.14 billion, which bodes well for future growth.
Microsoft
Revenue continued its impressive performance under the reign of CEO Satya Nadella, with revenue up 13% YoY (12% in constant currency) to $56.5 billion in 1Q FY 2024 (Microsoft’s financial year ends June 30). This translated into a 27% YoY (26% in constant currency) rise in net income to $22.3 billion, as Microsoft Corp (NASDAQ: MSFT) also curbed expense growth.
Microsoft share price
Intelligent Cloud was the standout performer, with revenue increasing 19% YoY, including 21% YoY growth at Azure–an acceleration from several quarters of declining revenue growth. This trend is expected to continue with guidance of 26%-27% YoY growth in 4Q, with an increasing contribution from Microsoft’s AI initiatives.
Productivity and Business Processes revenue increased 13% YoY to $18.3 billion, with double digit growth in Office Commercial products and Dynamics, Microsoft’s customer relationship management (CRM) product.
More Personal Computing segment revenue rose 3% YoY (2% excluding FX). This reversed a decline in the prior quarter as Windows OEM and gaming revenue were ahead of expectations while device sales declined.
Microsoft maintained its impressive history of capital return to shareholders, with $9.1 billion of share repurchases and dividends. It held a net cash position of approximately $72 billion at quarter-end and remains one of only two companies to hold a AAA credit rating from S&P.
Amazon
Amazon.com Inc (NASDAQ: AMZN) was the last of the tech giants to report (excluding Apple, which is yet to disclose its 3Q 2023 earnings results), and its results were well received by Wall Street. Net sales rose 13% YoY (11% excluding FX), including an 11% YoY increase in North America, 16% YoY (11% excluding FX) increase in International and 12% YoY increase in the company’s cloud division, Amazon Web Services (AWS).
Amazon share price
Operating income increased a whopping 343% YoY (338% YoY excluding FX) to $11.2 billion. Amazon is notorious for reinvesting the majority of its revenue and not reporting much in the way of operating income, but this trend may be changing as operating income has risen from $2.5 billion in 3Q 2022 to $11.2 billion in 3Q 2023. This included a huge rebound in North America, which suffered an operating loss in 3Q and 4Q of 2022, and a near break-even result in International, compared with a $2.5 billion loss a year ago. AWS operating income was just shy of $7 billion.
The most interesting question for Amazon investors will be the return on the company’s enormous capital expenditure programs, which have totaled more than $150 billion over the past 3 years.
Dominant now, but for how long?
Despite the ‘doom and gloom’ predictions at the beginning of the year, the U.S. and (to a lesser extent) global economies have proven resilient in the face of tighter monetary conditions and geopolitical uncertainty. Consumer spending has remained healthy, and the digital advertising market showed a strong rebound from the weakness at the end of 2022.
Each of the four tech giants posted strong double digit revenue growth and even stronger profit growth, with a renewed focus on cost control following more challenging business conditions in 2022. They continue to be phenomenal businesses with best-in-class financials and exceptional balance sheets with large net cash positions that, with the exception of Amazon, are used to return material amounts of capital to shareholders.
The only question that remains for investors is how long they can maintain their market-leading positions and continue to generate outsized growth for shareholders. In particular, have their share prices run too hard too fast?

