

For convenience, in this article “ETFs” refers collectively to all exchange tradeable funds available in the market, whether passively or actively managed, including products labelled “ETF”, “Managed Fund” and “Active ETF”.
2023 marked 22 years since the inception of the first two exchange traded funds (ETFs), in Australia, tracking the S&P/ASX 50 (INDEXASX: XFL) and S&P/ASX 200 (INDEXASX: XJO) indices.
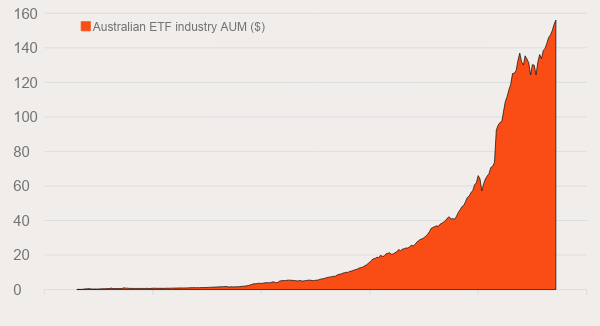
The industry has experienced remarkable growth since. From $100,000 of assets under management (AUM) in the first month, to $5B in the first 10 years, and standing at over $150B today. With more than 350 ETFs now available in Australia covering all major asset classes, many might be wondering how the ETF we got here.
As Betashares celebrates a milestone of $30B in AUM we look back at what has driven growth in Australia’s ETF industry over the past two decades.
Chart 1: Australian ETF industry AUM ($M): Jul 01 – Aug 23
The bedrock of Australia’s ETF industry – Core equity index ETFs
The growth of ETFs globally has been synonymous with the popularisation of low-cost, broad benchmark equity index investing.
Australia’s story has been no different.
The marrying of these investing advancements provided investors with easy-to-transact, low-cost access to diversified portfolios. This style of ETF, tracking broad equity market benchmarks, remains the most popular today.
Of the 10 largest ETFs in Australia today eight could be classified as ‘core equity index funds’. These eight alone account for 30% of the total AUM in Australian ETFs. Funds like Betashares Australia 200 ETF (ASX: A200) and Betashares Nasdaq 100 ETF (ASX: NDQ) feature in this list.
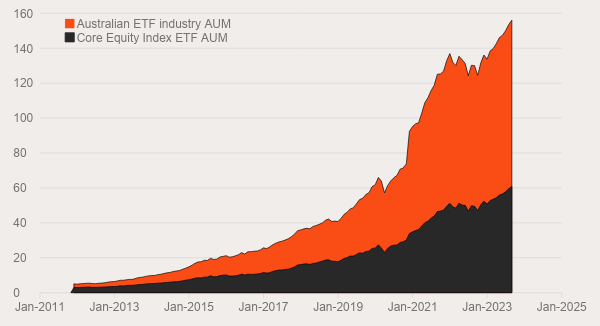
In total, there are 24 core equity index ETFs in the Australian market accounting for 40% of total industry AUM. While this is still by far the largest category, that number was closer to 60% in 2011 as other types of ETFs have helped to drive industry growth since.
Chart 2: Core equity index ETF AUM and Australian ETF industry AUM: Oct 2011 to Aug 23
A new era – Fixed income ETFs
The last time the Australian 10-year government bond yield was 4.5% p.a. there were no cash or fixed income ETFs listed in Australia. Today there are 53.
As markets enter this new era the availability of fixed income ETFs for Australian investors has seen a noticeable trend in investor preferences.
Over the 18 months to August 2023, cash and fixed income and ETFs saw $8B in inflows while unlisted fixed income funds saw $12B in outflows.
Chart 3: ETF and unlisted fixed income monthly net flows: Mar 22 to Aug 23
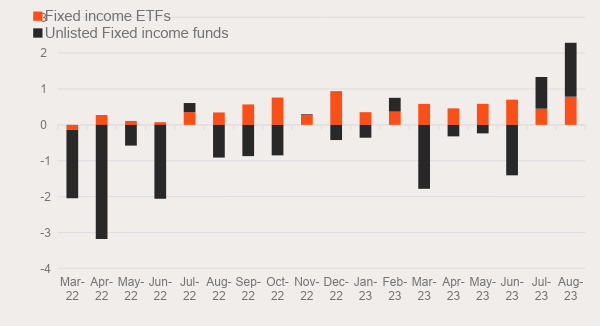
These flows have driven growth in Australia’s ETF industry over the past 12 months as cash and fixed income ETFs accounted for 56% industry net flows.
Teaching an old dog new tricks – Active ETFs
Active ETFs account for 15% of Australia’s ETF AUM making them the second largest category behind core equity index ETFs.
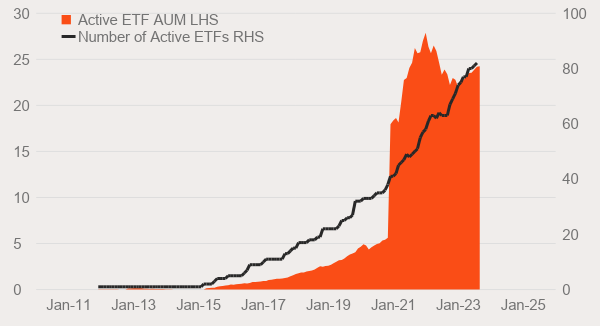
The growth behind active ETF AUM has been unique in that 90% of this amount has come on conversion of existing unlisted active funds to the ETF structure. The remaining 10% coming from net flows.
Despite the number of active ETFs more than doubling over the past three years from 35 to 82, this category has actually seen net outflows over this period of $2B (excluding conversion AUM).
Chart 4: Growth of active ETFs in Australia: Nov 2011 to Aug 2023
Australian ETFs’ green shoots – ESG ETFs
One of the biggest trends in the investment landscape over the past five years has been the focus on environmental, social and governance (ESG) aligned investing.
Over the past four years, the number of ESG-related ETFs, including passive and active funds with ESG screens, climate impact funds, and ESG-related thematic exposures, has grown from 16 to 57.
Over the same period, ESG ETFs have more than tripled their share of Australia’s total ETF AUM (from 2% in 2019 to 7% in August 2023).
Chart 5: Growth of Australian ESG ETF AUM: Jan 2015 to Aug 2023
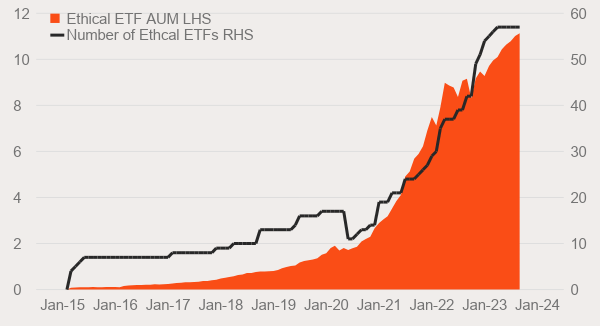
Betashares proudly offers what is currently the largest suite of ESG ETFs in the Australian market in terms of funds and AUM. Our core suite of ethical ETFs [Betashares Australian Sustainability Leaders ETF (ASX: FAIR), Betashares Global Sustainability Leaders ETF (ASX: ETHI), Betashares Global Sustainability Leaders ETF-CurH (ASX: HETH) and Betashares Sustainability Leaders Div Bond ETF-Hdg (ASX: GBND)] account for over 40% of the entire ESG ETF AUM in Australia.
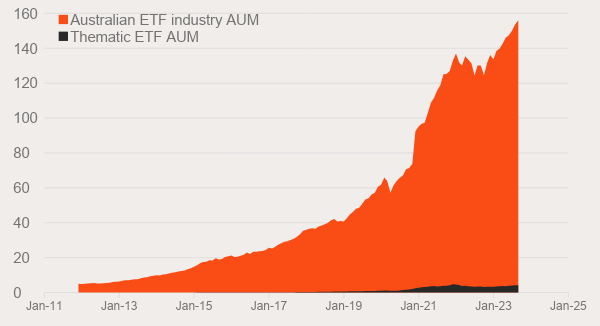
The surprise – Thematic ETFs
Based on market noise around ETFs, you might be forgiven for mistaking thematic ETFs as one of the largest contributors to industry AUM.
Thematic ETFs’ benefits in offering investors low-cost access to focused investment strategies, the potential for long-term above-market growth opportunities, and diversification into areas under-represented in core holdings should not be understated.
However, their actual AUM as a portion of the Australian ETF industry sits around 3%. This is the smallest of the analysed categories.
Chart 6: Thematic ETF AUM and Australian ETF industry AUM: Oct 2011 to Aug 23
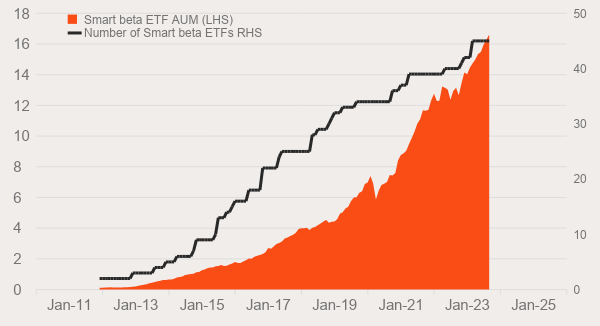
The future? – Smart beta ETFs
When looking for future areas that could be key to the growth of Australia’s ETF industry, smart beta ETFs stand out.
With active managers under pressure due to typically charging higher fees and a majority of active funds not outperforming benchmarks over the long term, investors are increasingly turning to smart beta ETFs.
Smart beta ETFs are still passive index tracking funds, however their indices differ from traditional benchmarks in the ways they select and weight their underlying holdings.
The number (45) and percentage of total industry AUM (11%) of smart beta ETFs has been steadily growing over the past decade.
Chart 7: Growth of smart beta ETFs in Australia
The Australian ETF industry has seen impressive growth over the past two decades.
The last decade has seen the Australian industry largely following in the footsteps of the US industry, with many of the same trends being observed. With the local industry now mostly caught up in terms of product offerings and ease of access, we expect market penetration relative to unlisted managed funds to follow a similar trajectory to what’s been observed in the US.
In the US, ETF AUM now sits at about 20% of managed fund AUM. Locally, this number is closer to 5%. If the overall funds management industry continues to grow as projected, and ETF penetration reaches the same level as the US, Australian ETFs could grow to a trillion dollars of AUM.
Perhaps even within the next five to 10 years.


