
This article is an extra special deep dive from our friends at NAOS Asset Management. Robert Miller dives deep into trucking and transport, offering you a thorough understanding of businesses like Maxiparts Ltd (ASX:MXI). Over to Rob…
***
Look around outside, it is likely the factors influencing our daily lives can form the basis of sound investment ideas.
At NAOS, we firmly believe in the notion of investing in industries that are benefitting from long-term structural tailwinds.
Investing behind tailwinds can provide a solid margin of safety and foundation for long-term returns for an individual company as growth in a growing market is likely far easier than growth in a shrinking market.
Whilst we have a concentrated approach to investing, we attempt to analyse in detail the select industry nuances that may create a long-term tailwind.
Our roads today – A heavy focus
Australia has just surpassed 21 million registered vehicles on our roads, or 1 car for every ~1.25 people.
What is of more importance for this article is the recent increase in the average annual age of our vehicles from 10yrs old to 11yrs old since 2019.
Whilst that might not seem a significant change on an isolated basis, when you consider that age change across the total number of vehicles in Australia, it starts to have secondary impacts.
Vehicle shortages during COVID directly impacted our ability to replenish our roads with new vehicles.
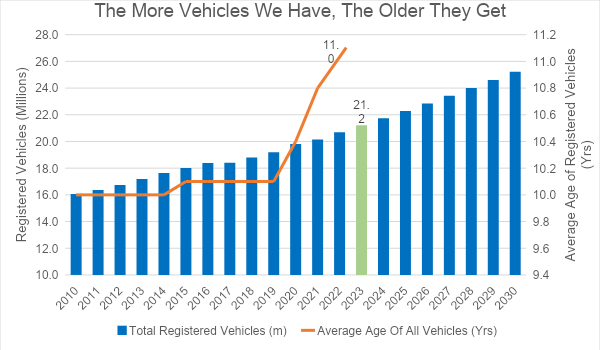
Source: Australian Bureau of Statistics, Bureau of Infrastructure and Transport Research Economics, NAOS Forecasts
When segmenting the registered vehicle landscape, heavy rigid vehicles (or ‘trucks’ as we will refer to) are far older, with an average age of 16.3 years.
For context, the average truck age in the year 2000 was the same as it was in 2010.
In recent years, given the lack of spare capacity of trucks within the industry (in conjunction with COVID related supply chain issues), trucks are not being retired, and rather are being used for longer, with new truck supply arriving in Australia not lowering the average truck age.
| Year | Average Truck Age (Yrs.) |
| 2000 | 15.4 |
| 2010 | 15.4 |
| 2020 | 15.7 |
| 2021 | 15.9 |
| 2022 | 16.3 |
Source: Australian Bureau of Statistics
Trucking it up is getting harder
The road freight industry shows no signs of slowing down.
From the current national road freight usage levels, the Bureau of Infrastructure and Transport Research Economics (BITRE) forecast suggests this will double by 2050.
Putting aside any conversations around the infrastructure required to underpin this growth, the simple reality is that more and more trucks are required to move an ever-increasing level of freight.
As it stands, that is happening with older trucks.
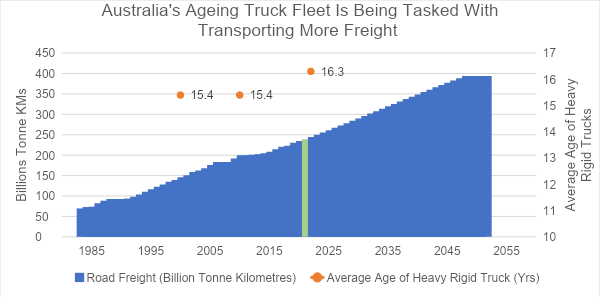
Source: Bureau of Infrastructure and Transport Research Economics
The Truck Industry Council (TIC), which is the independent, not-for-profit peak industry organisation, stated in its ‘National Truck Plan Report’ the following reasons for Australia’s ageing truck fleet:
- Freight efficiencies and a company’s “bottom line” profitability:
- Due to safety & environmental standards new trucks are required to meet, a newer truck carries a smaller payload compared to an old truck, reducing productivity.
- Inefficient market dynamics:
- No secondary market exists for Australia’s older trucks beyond Australian shores compared with other countries that sell their second-hand trucks to developing countries.
- “Fix it up, keep it going”:
- The Australian truck culture with a focus on retaining the truck rather than replacing it.
- Poor uptake rate of new technologies:
- New alternative powered/fuelled truck technologies lag other vehicle categories providing less impetus for change to keep up with technology.
Whilst we believe the uptake rate of new technologies will continue to improve over time, to us, some of the abovementioned factors driving an ageing truck fleet appear to be structural in nature.
The TIC seems to agree, noting in 2019 that to reverse the trend of ageing trucks in Australia we would need a drastic change in the status quo.
Since 2019, the ageing of the Australian truck fleet has significantly increased, with the likelihood of a decade of record sales not realistic given the COVID impact upon supply chains.
“In fact, it would take ten years of record sales to reduce the age of the truck fleet to the pre-GST average age of 14.4 years. This is not an enviable position for Australia to find itself in”
Truck Industry Council, National Truck Plan, 2019
Ageing consequences
You can certainly run the argument that over time vehicles have continually been manufactured to higher standards and therefore they are capable of being operated for longer periods of time without major break downs.
While this is a very reasonable blanket statement to make, there are also other factors to consider.
Rebased to 100 in 2012, the chart below shows a relatively modest occurrence of motor vehicle (not just truck) price changes between the late 1990s up until the impact of COVID in 2020.
What this chart also highlights are that the ancillary costs (e.g., repairs, servicing, parts, and accessories) have had very little downward price movement over the long term.
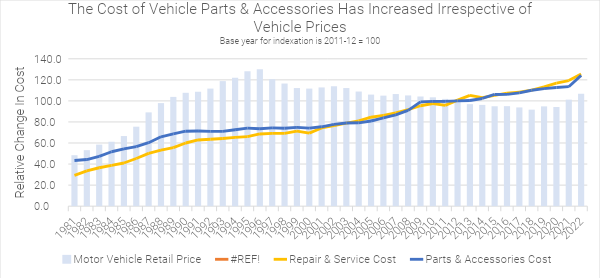
Source: Australian Bureau of Statistics, Bureau of Infrastructure and Transport Research Economics
In addition, technological improvements have brought added complexity to all vehicles over time.
Yes, they are safer
, smarter and easier to use, but there are also an increasing number of specialist parts in newer vehicles that require repairing, servicing and replacing.
For example, a new vehicle’s front windscreen now contains a multitude of cameras, lasers and radars that go into creating an Advanced Driver Assistance System.
| Bicycles | Vehicles | Aeroplanes | |
| # of Individual Components | ~900 | ~30,000 | ~6,000,000 |
Source: National Automotive Parts Association, 2019
The ‘Picks & Shovels’ investing approach – Aftermarket providers
Identifying what select categories, manufacturers or brands will do well in the commercial vehicle category is not something we believe we have a great deal of expertise in, nor a risk return scenario we at NAOS would consider attractive.
However, there are certain companies able to provide a more general exposure that could directly benefit from Australia’s ageing trucks – specialist independent aftermarket parts distributors.
In Australia, the specialist-independent aftermarket parts distributors will often sell thousands upon thousands of individual parts sourced from a wide array of global aftermarket suppliers.
As the ‘gatekeepers’, they would then sell these parts to thousands of Australian-based customers.
These B2B business models do no manufacturing themselves (albeit some have their own private label brands), rather they are capital light operations specialising in sourcing, importing, warehousing and freighting of parts to customers as soon as they are required by customers.
What is the Aftermarket?
The term ‘aftermarket’ refers to the manufacture and sale of replacement parts and accessories to vehicles which are designed to fit and function like the original part they are replacing. The concept is hardly a foreign one.
According to the latest Fortune Business Insights Automotive Aftermarket, globally the industry is worth ~US$400bn.
Let’s consider a commercial vehicle example of an OEM (Original Equipment Manufacturer) Kenworth Trucks Australia, which is made up of thousands of individual parts. When any of those parts need replacing (e.g., mudguards, axels, tyres, spark plugs, etc.) the owner of the Kenworth truck may source these parts directly from Kenworth, or they may choose to source these parts from the aftermarket, which can be a more cost-effective source that can offer a direct replacement product albeit not branded Kenworth (or the original brand of the individual part).
The manufacturers of these aftermarket replacement parts are often offshore groups who sell in many countries around the world and likely don’t sell direct to customers in Australia, and therefore would use third party distributors to import and sell these products into the Australian market. Long term relationships often exist between offshore aftermarket manufacturers and local distributors.
Why does the aftermarket exist?
There are a numerous reasons why a commercial vehicle operator may choose to use an aftermarket replacement part versus an OEM-sourced replacement part but it predominantly comes down to two, being:
- Cost savings
- All parts eventually need replacing and stricter regulations around commercial vehicle safety requirements aid this replacement cycle.
- From an economic perspective, as long as the quality is comparable, many commercial vehicle operators will prefer to use a more cost-effective replacement part, especially if the vehicle is outside its initial warranty period and/or has been on sold to a subsequent owner in the used vehicle market.
- Time savings
- A commercial vehicle operator’s revenue from that truck or bus comes from active use. Therefore, any time a particular vehicle is not in operation is a missed opportunity to generate revenue.
- If a truck breaks down, the owner will look to source the appropriate replacement part as soon as practically possible.
The age of a vehicle also impacts where replacement parts come from. The below bell curve demonstrates that in the earlier years of a commercial vehicle lifecycle, replacement parts typically come from the OEM, a logical outcome given the typical 5-year manufacturer’s warranty period for a new vehicle.
After the warranty period expires, OEMs may still offer replacement parts, but competition begins from aftermarket replacement part providers who will often win given the time and cost benefits.
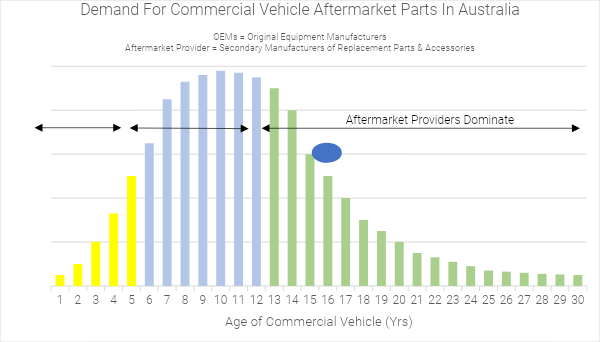
Source: Supply Networks, NAOS
Who operates in the commercial vehicle aftermarket sector?
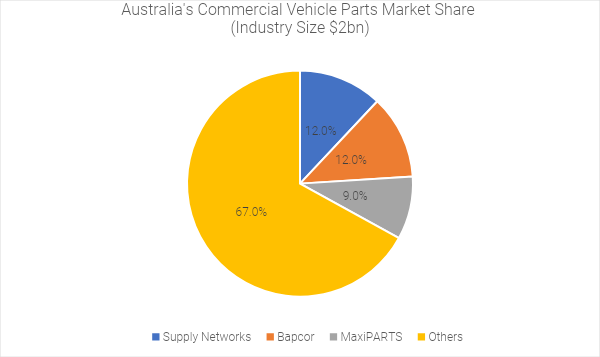
There are three ASX listed companies which operate in the truck/bus aftermarket parts industry within Australia:
All three have a national footprint and whilst there is limited overlap between product offerings, all three appear to operate with their own specialist focus within the approximately $2bn industry.
Combined, the three companies (referred to as the ‘Big 3’) represent ~30% market share. With no other major operators in the space, it is not unreasonable to see their collective market share continue to increase over time.
The ‘Big 3’ are nationwide professional operations with high reliability for customers with urgent problems that need efficient solutions.
Source: Ord Minnett, Company Financials
Company in focus – Maxiparts Ltd (ASX: MXI)
NAOS is a substantial shareholder in the smallest of the ‘Big 3’ aftermarket commercial vehicle operators. MaxiPARTS, previously part of the listed company MaxiTRANS, underwent a demerger of their capital heavy manufacturing business in mid-2021.
What remained was a specialist independent aftermarket parts distributor to the commercial vehicle sector.
Maxiparts Ltd (ASX: MXI)
With ~27 locations across 5 states, MXI’s focus is on selling replacement axels, suspensions, wheels, brakes, trailer products to a vast range of truck customers (fleet operators, individuals, workshops & trailer manufacturers).
The recent acquisitions of both Truckzone and Förch Australia have enhanced MXI’s product range offering for North America & Japanese commercial vehicles, as well as providing an adjacent range of consumable products to automotive/commercial vehicle workshops respectively.
The highly complementary workshop consumable product sector in our opinion offers MXI with a substantial adjacent future revenue opportunity to grow into.
When MXI was part of the MaxiTRANS Group, we believe it didn’t get the attention it deserved despite being the ‘jewel in the crown’ managed by a very competent CEO.
NAOS kept close tabs on the Group in the hope one day the capital light MaxiPARTS operations would be liberated, which eventually occurred through the recent demerger in 2022.
Post demerger, MXI is now standing on its own two feet and playing ‘catch up’ to its peers.
Evidence of this we can see in the below graph showing the earnings margins of the ‘Big 3’ over time where MXI’s margins have improved from 1.4% in FY20 to 6.4% in FY23.
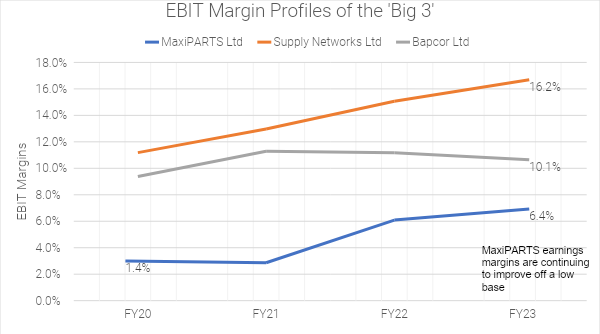
Source: CapIQ, Company Financials
In our analysis of Bapcor, it is worth noting that they operate in a far larger car parts business as well as its commercial vehicle parts division, making a true like for like margin profile difficult to line up.
Supply Networks focuses solely on the commercial vehicle sector however has a stronger presence in buses (as opposed to trucks) than MaxiPARTS.
So while neither provide a direct like for like comparable, the analysis provides context to the MaxiPARTS opportunity ahead.
Whilst it might be unlikely that MXI can achieve the same level of earnings margins as Supply Networks (due to product mix), if we fast-forward over the next few years, we do believe the substantial margin differential can reduce.
If we then analyse the valuation multiples of MXI and Supply Networks, we can see MXI trades at a material discount.
Whilst relative valuations are by no means the be all and end all, it does indicate to us that if MXI can start to deliver in a similar fashion to the consistently outstanding long-term performance of Supply Networks, then perhaps the valuation difference could also reduce over time.
If this were to occur, then in theory investors could experience the ‘double whammy’ of improving margins and increasing earnings multiple.
| FY23 EV/EBITDA | FY23 P/E | FY24 EV/EBITDA | FY24 P/E | ||
| Supply Network Ltd (ASX: SNL) | ~14 | ~23 | ~13 | ~21 | |
| Maxiparts Ltd (ASX: MXI) | ~10 | ~18 | ~8 | ~15 |
Source: CapIQ (as at 12th September 2023)
As highlighted throughout this article, there are clear structural tailwinds as to why aging commercial vehicles should continue to underpin the aftermarket parts sector. In addition, we believe that aftermarket parts are far less susceptible to a slowdown in consumer behaviour as commercial vehicles keep operating regardless of any change in the retail car market.
Once you add the spread of customers and parts suppliers, this diversification offers the ‘Big 3’ a buffer of insulation against a wider macroeconomic slowdown.
An electrified world
The shift to renewables will benefit and transform many aspects of our lives, including very clearly, the vehicles we drive. Many industries are still in their early days of this renewable energy world.
As we can see below, Australia lags behind global statistics for electric vehicle sales, forecasting approximately 7% for 2023, compared to 18% globally. Despite the low penetration, electric vehicle uptake is growing quickly, up from 3.8% in 2022.
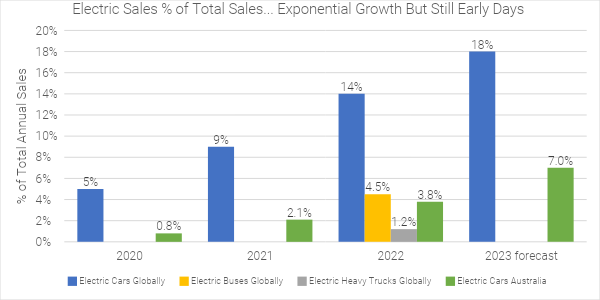
Source: International Energy Agency, Australian Electric Vehicle Council, CarExpert, NAOS forecasts
Whilst it seems like a ‘when, not an if’ we become a fully electric vehicle world, the truck space faces more complexity to adoption. Global EV truck adoption is well and truly nascent with electric sales only representing 1.2% of truck sales in 2022. Overlaying this is the uncertainty relating to which technologies may be most applicable for trucks (electric vs hydrogen), resulting in a waiting game for technology and adoption to play catchup.
If we fast forward to the day whereby ubiquitous internal combustion engine vehicles are a thing of the past, with fewer moving engine parts, these electric/hydrogen vehicles will likely have less components than today.
According to a New Zealand government organisation called Drive Electric, there are ~20 moving parts within an electric engine compared to ~2000 in an internal combustion engine. Despite this, there are other parts & components of vehicles that are actually predicted to suffer more wear and tear than in vehicles of today, and at a higher replacement cost, such as tyres, which need replacing more often given the heavier weight of an electric vehicle.
The electric vehicle supply chain for replacement parts is yet to ‘institutionalise’ compared with the status quo. This is logical given the nascent stage of the industry. The result is replacement parts that are often more expensive with longer lead times than a comparable internal combustion engine part.
In addition, as the transition occurs there will be a significant period of time where internal combustion & electric/hydrogen co-exist side by side. Duplication of parts and accessories for the respective vehicles will be required for many years to come.
In fact, you could argue this next 20+yrs of co-existence will place even greater emphasis on the importance of aftermarket parts distributors as experts in the field helping customers navigate an increasingly complex market.
NAOS takeaways
We acknowledge that analysing an industry does not provide a complete investment thesis on a particular company and that many other factors should be considered. There appears to be a genuine and ever-increasing importance for specialist commercial vehicle parts suppliers to the trucking industry, especially when considering the growing reliance on ageing trucks driving on our roads in the years ahead.
With a capital light business model, resilient customer base and a competent management team, we believe MaxiPARTS should be able to take full advantage of the available opportunities, hopefully resulting in long-term returns for shareholders.