
The S&P/ASX 200 (INDEXASX: XJO) and All Ordinaries (INDEXASX: XAO) took a bath on Tuesday, following US markets overnight. Today, Wednesday, the S&P/ASX 200 is tracking 0.4% lower.
Why is the ASX 200 falling?
The chart above shows the performance of the SPDR &P/ASX 200 ETF (ASX: STW) — an ETF that tracks the ASX 200 index.
So what’s the culprit behind the ASX 200’s market sell-off?
Interest rates.
In particular, US interest rates — which are expected to rise further due to inflation.
Here in Australia, the RBA (the organisation tasked with setting our interest rates) thinks we could experience inflation above the current 5.1%. Meaning, the “official” interest rate could rise well above the current 0.85% to, say, over 2% or more. That would put pressure on homeowners and investors alike.
In an interview last year, Warren Buffett said “interest rates basically are to the value of assets what gravity is to matter.”
Translation: the higher interest rates go, the more downward pressure there will be on stocks.
What does the ASX 200 crash mean to me?
So what does the ASX 200’s fall actually mean to me or you?
Yesterday, I took to Rask’s YouTube channel to explain some of the things that help ease my mind when it comes to market crashes and avoiding the scary headlines.
I’ve inserted the video below.
Could the ASX 200 keep falling?
Yes.
No-one knows for sure where the Australian share market will end 2022. Just like no one can guarantee the exact level of interest rates in 12 or 24 months from now.
I find it’s best to acknowledge that bad things can happen (and likely will at some point) but over the ultra-long-run things tend to get better, not worse.
Is the ASX 200 overvalued?
In recent years, one of the most popular ways to ‘value’ the stock market has been to look at something like the average price-earnings ratio for the entire market
. Meaning share prices dividend by profits/earnings per share (P/E).
In the US, they call this the Shiller PE or CAPE ratio. It adjusts for inflation.
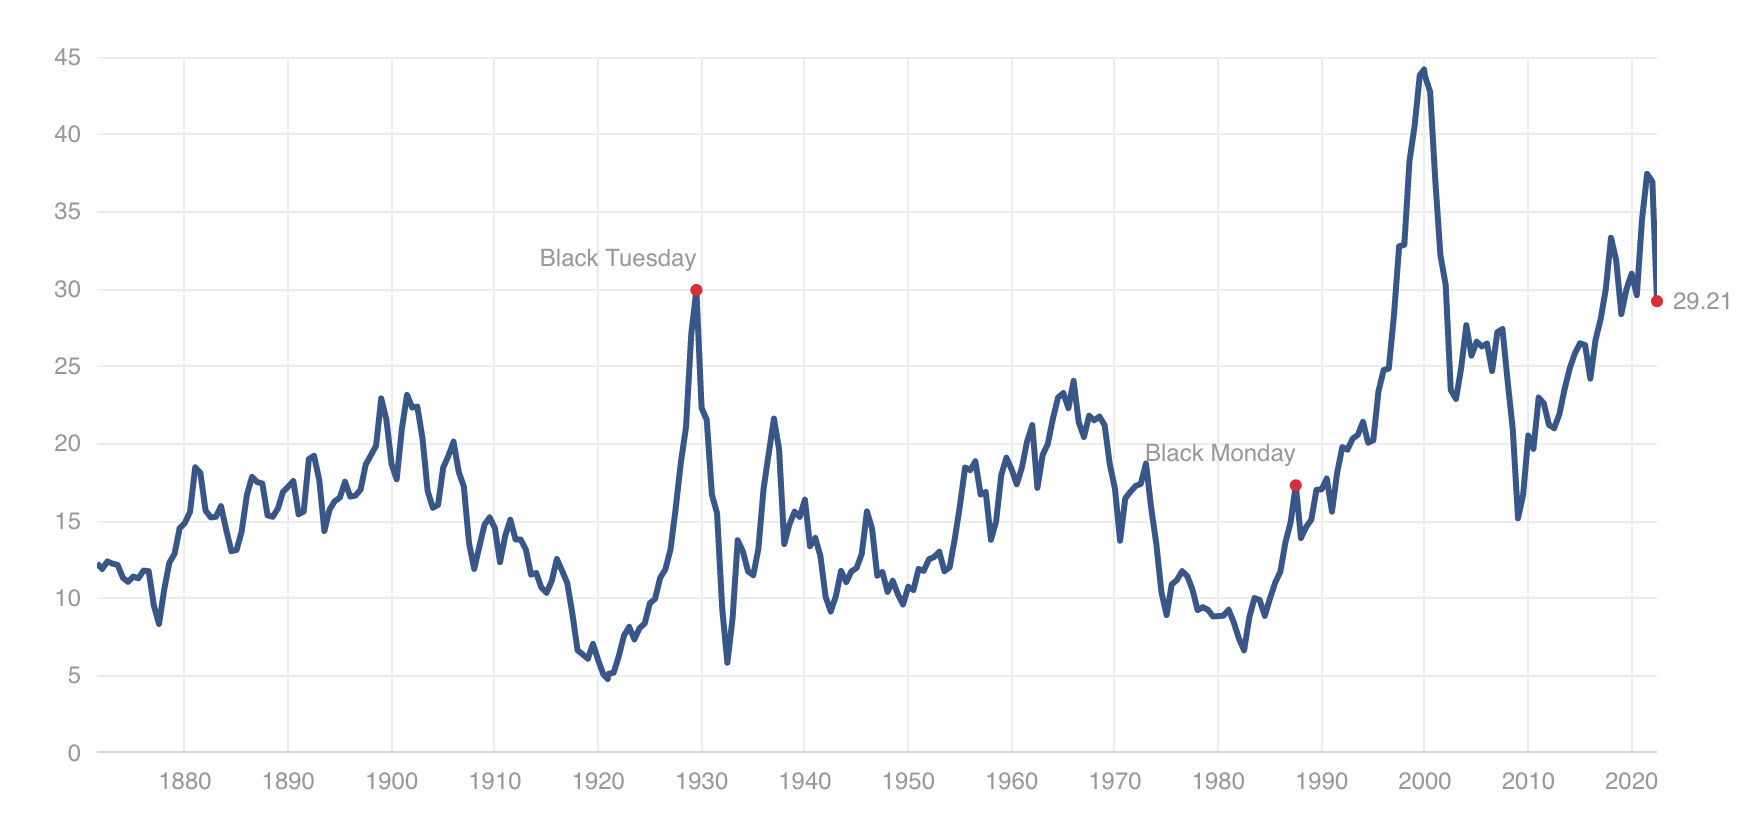
Shiller PE ratio
Basically, the ratio compares the profits of the largest 500 companies to the share prices. As you can see above, while the ratio has fallen (due to stock prices falling) the ratio is still quite high, by historical standards.
For me personally, I believe it’s not ideal to take ‘the PE ratio today versus 1990’ and make an investment based purely on that — because the world is very different today. However, it might still give us some indication as to where the US market is priced. The long-term average is around 17x.
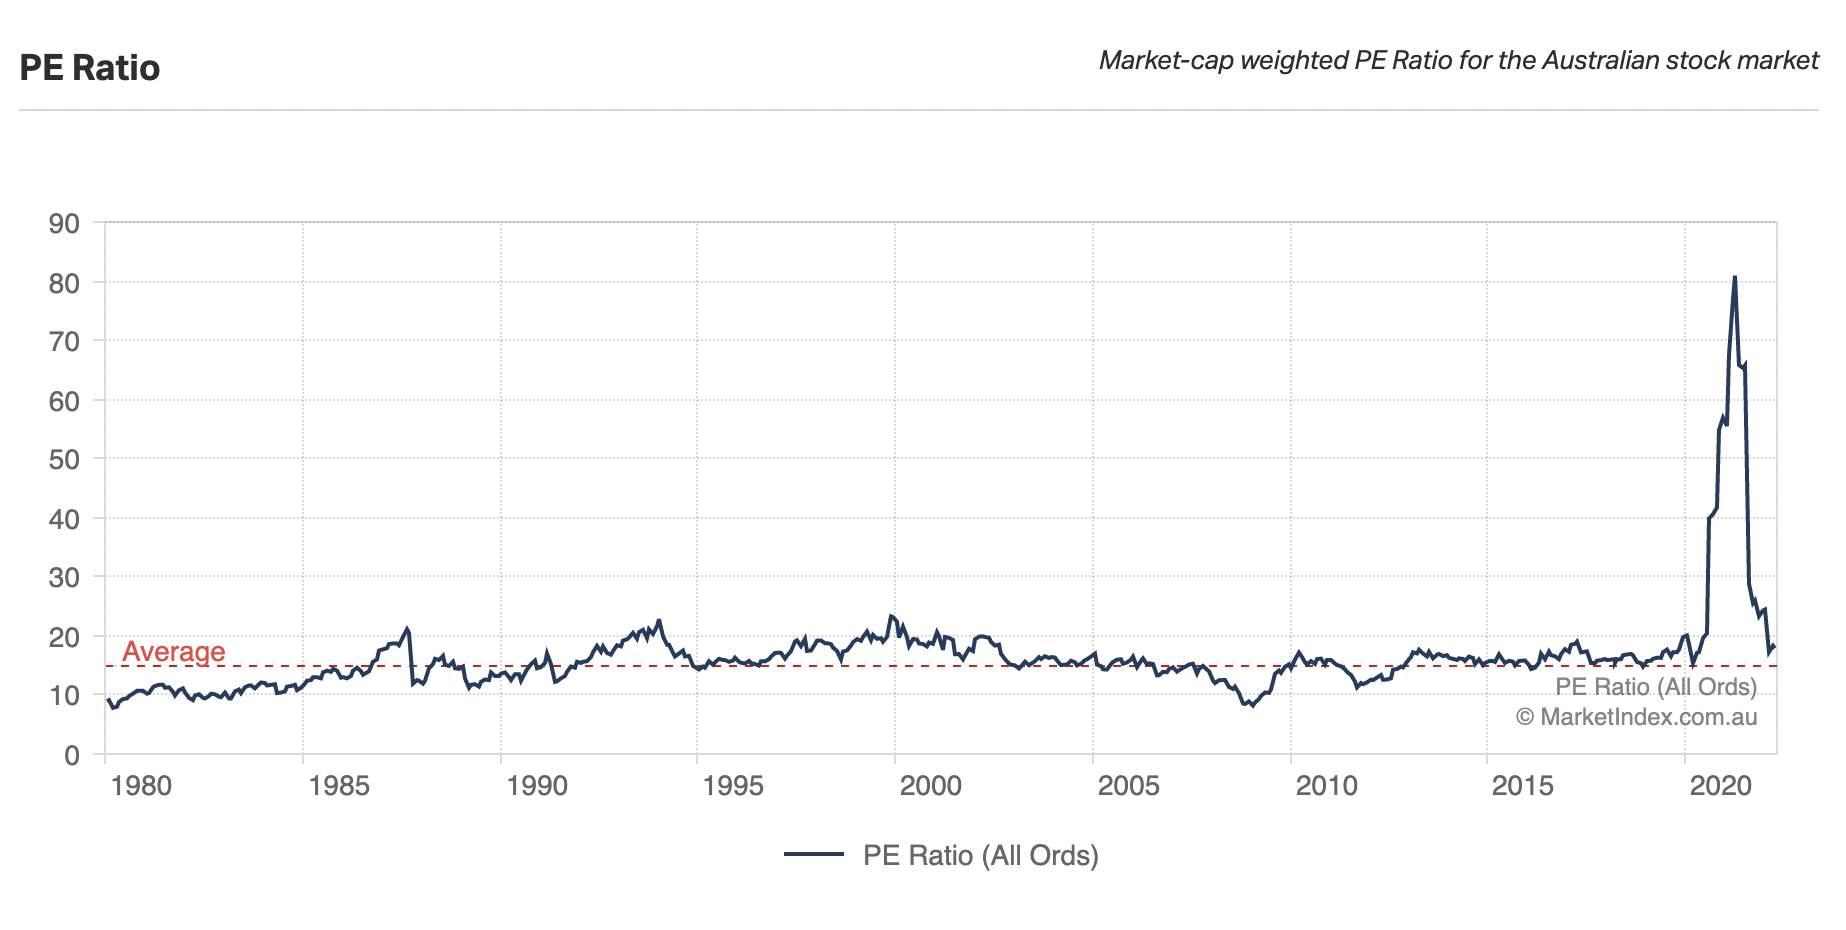
Back in Australia, the Australian share market’s average price-earnings ratio is also around 17x. However, as you can see here, in this chart from Market Index, we’re not that far above average.
What’s next for the ASX 200?
In summary, depending on which way you slice and dice the market, you’ll get a different answer to what level is normal. And you can take it from me that no-one knows for sure where the ASX 200 or S&P 500 will end. Not the journalists and headline writers, nor economists or private investors.
As I say in the video above, I think it’s vital to focus on what you can and cannot control. One of those things is your behaviour under pressure.
I’m excited by the prospect of buying shares at lower prices…


