

At just under $17 per share, the Appen Ltd (ASX: APX) share price does look a lot cheaper considering it was trading well over double this amount in August last year.
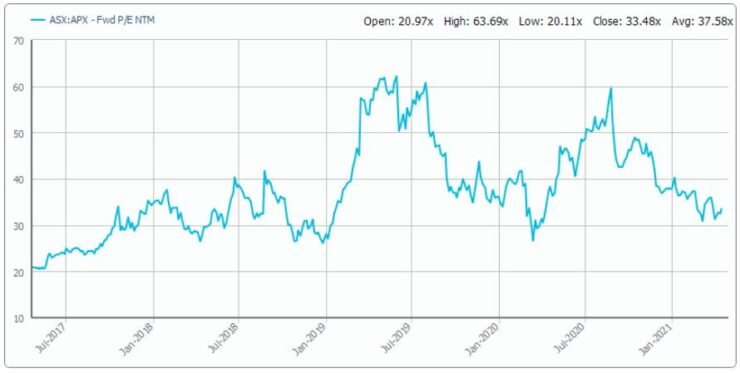
Observing Appen’s historical Price/Earnings (P/E)
ratio is another useful way to gauge sentiment behind its shares.
Earnings is just another word for profit, so the ratio essentially tells us the multiple that investors are willing to pay for the company’s profits. This is important because unlike just looking at a share price chart, the historical P/E ratio can uncover whether fundamental earnings growth caused its valuation to increase.
As you can see from the below chart, Appen’s valuation experienced a rapid increase that outpaced underlying profit growth from the bottom of the market in March last year.
Updates from Appen around May last year made the economic conditions at the time seem not as serious as they perhaps were later on. Management seemed fairly confident that earnings would be resilient throughout the pandemic and that its major customers were experiencing high usage.
Based on the current information at the time, everything appeared to be business as usual.
Sentiment around Appen’s shares continued to rise throughout this time and investors were happy to pay a higher multiple for its underlying profit.
What happened?
While management did acknowledge in April last year that COVID-19 could result in a slowdown of digital ad spending, this was only concerning Appen’s smallest customers. As such, guidance was restated with underlying FY20 earnings before interest, tax, depreciation and amortisation (EBITDA
) to be between $125 – $130 million.
When the COVID-19 situation worsened in the US, it became evident that many of its larger customers were badly affected due to the lockdowns in California. FY20 EBITDA came in at $108.6 million.
Could Appen’s shares be a buy today?
It seems management underestimated COVID-19 and the effect this has had on its customers’ spending and priorities. This isn’t so much a criticism of management though, as the extent of COVID-19 couldn’t have been predicted.
That being said, it could also be a possibility that management is overconfident in its ability to strongly emerge from a post-COVID environment.
FY21 EBITDA is expected to be between $120-$130 million, so it seems as if management believes the worst has passed. But its historically low P/E shown from the chart above could imply the market may have priced in a slower recovery.
I’ll be waiting for Appen’s next trading update that would suggest its pandemic headwinds have hopefully just been transitory. Up until then, Appen remains a hold.
If you are interested in other ASX growth shares, I suggest getting a free
Rask account and accessing our full stock reports. Click this link to join for free and access our analyst reports.