

In the stock market, anchoring is a cognitive bias that impacts the way we evaluate prices from pre-existing information.
For example, have you heard something like this: “XYZ stock has fallen recently, therefore shares must be a bargain today at these levels!”
Market dips and sell-offs can present fantastic buying opportunities because they can sometimes allow us to pick-up quality companies at discounted prices. But what happens when the lower share price is still above the intrinsic or fair value? Are we still getting a good deal?
This Rask Education video explains share valuations. Below, I use comparative valuation theory with the example of Zip Co (ASX: Z1P).
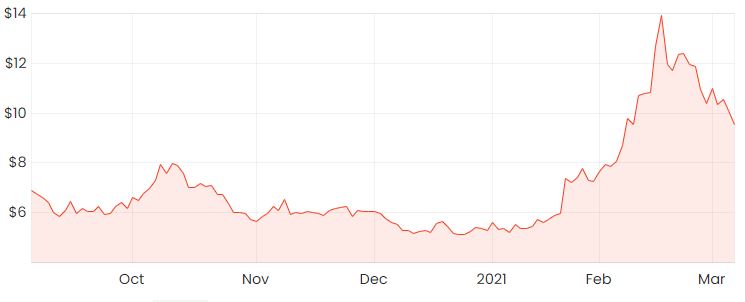
Z1p share price
Comparative valuation
One way investors arrive at a valuation is to compare a company’s market capitalisation to a competitor and value our company on the same sales or profit multiple.
However, be careful. The companies might have different/better products, different addressable markets/growth opportunities and there’s also a big assumption that your comparison company is also fairly valued in the first place.
The rallying stock price of the recently listed buy-now-pay-later (BNPL) company Affirm Holdings Inc (NASDAQ: AFRM) might be a good example.
With Affirm’s share price hitting a peak of US$140 and a market capitalisation of $35 billion at the height of the rally, this would have put its shares on a forward Price/Sales (P/S) ratio of 48x based on FY21 revenue guidance figures.
Zip Co’s shares subsequently rallied following the positive investor sentiment around Affirm, with many investors commenting that it was significantly undervalued based on some of the multiples its competitors were trading on, including Afterpay Ltd (ASX: APT). Afterpay shares trade on roughly 34x forward sales based on analyst consensus estimates for FY21 revenue, even after its share price has fallen over 30% in the last few weeks.
Taking the more conservative multiple between Affirm and Afterpay and applying a 34x sales multiple on Zip’s FY21 revenue forecast, we would still end up with a fairly high implied market capitalisation of $12.6 billion, or a share price of $22.80 per share using this method.
Are Zip’s shares really worth $22.80 each? Maybe. But I don’t think so.
I don’t think the two companies are very comparable for valuation purposes because the assumption is that Afterpay’s valuation is fair, which I’m not sure about.
How can we value Zip’s shares?
In a growing, disruptive industry such as BNPL, trying to calculate a fair share price exactly would be comparable to crystal ball gazing.
In one of Howard Mark’s recent memos, he talks about how in rapidly growing industries an investor with a comprehensive qualitative understanding of a company concludes it possesses great potential for growth and profitability. In this situation, the investor will most likely realise it’s impossible to precisely quantify this potential.
The solution to this could be to hope you have the direction and value approximately correct and to continue holding as long as the evidence suggests that the thesis remains intact.
To get an approximate valuation, I’ll work my way backwards by starting with Zip’s market capitalisation and determining what the implied profits would need to be to justify its current valuation.
Zip has a current market capitalisation of $5.2 billion, and I’ll assume that after it matures (e.g. in a few years) its shares might trade on a P/E ratio of 40x. Meaning, it would need to generate roughly $130 million in pre-tax earnings for the P/E ratio to equate to 40x.
Please keep in mind this number is arbitrary but I think it adds a good margin of safety as it is significantly higher than the industry average P/E of 10x for financials.
I know that Humm Group Ltd (ASX: HUM) is a profitable BNPL that achieved a net profit margin of 7% in FY20. I’ll give Zip an extra margin of safety and assume that it’ll be able to achieve a 10% margin after it matures out.
Zip is expected to generate roughly $370 million of revenue in FY21 based on analyst consensus estimates, which would give $37 million in net profit, based on a hypothetical 10% net profit margin.
At $37 million in profit, it seems quite far off the implied profit of $130 million we would need based on its current market capitalisation. This is after its shares have fallen the last couple of weeks, and why I still struggle to see how they look cheap.
How I use this valuation
I use a quick multiples-based valuation such as this as a rough sanity check on prices, not as a hard and fast rule for investing.
It is worth noting the potential growth opportunity ahead of Z1p especially as we emerge from COVID-19 with the accelerated adoption of e-commerce.
Zip operates in an estimated $22 trillion total addressable market (TAM) and so far, BNPL only has 1.6% penetration in global e-commerce spending. The competition is fierce, but even with a small slice of the pie perhaps Zip’s current valuation will look minuscule in 10 years time.
So there’s an argument to be made for both sides here but at these levels I think the market capitalisation implies a blue-sky scenario with perfect execution along the way. I’d rather wait a bit longer to see how the thesis plays out.