

Wesfarmers Ltd (ASX: WES) shares were relatively unmoved by the company’s FY19 results released last week, and the share price currently sits at $39.10. Let’s take a look at the results and work through a valuation…
Firstly, Wesfarmers is a 100-year-old conglomerate which at various times has owned and operated some of Australia’s largest retail brands such as Kmart, Target and more. Today, its largest business is Bunnings Warehouse, the number-one DIY home improvement business.
FY19 Results
You can read all about the results in this Rask Media article
, but for a quick overview:
- Revenue was up 4.3% to $27.9 billion
- EBIT grew 12.2% to $2.9 billion
- Net profit after tax (NPAT) increased by 13.5% to $1.9 billion
- The full-year dividend grew nearly 25% to 278 cents per share
The dividend is the important figure that we will be looking at for this (rough) valuation.
1 Way To Value Wesfarmers Shares
If you want a quick way to value Wesfarmers shares, you can use the most recent dividend and assume a growth rate. This valuation method is called the dividend discount model or DDM.
Using this dividend discount model, we take the most recent dividend and divide it by the required rate of return (or risk rate) minus the growth rate. The 2019 full-year dividend was 278 cents per share (cps), up 24.6% from 223 cps in 2018.
However, a 25% growth rate is not going to be sustainable over the long term. Going back a few years to 2015, the dividend was 200 cps, so we can work out that the growth rate over the last four years has been roughly 8.5%. To be even more conservative, we should use a lower growth rate.
The other figure we need to calculate a valuation is the risk rate. For a large, established company like Wesfarmers with a sustainable competitive advantage, we can assume the risk is relatively low and might be 8-10%.
If you don’t just want to guess, you can calculate a risk rate using some assumptions, recent data, and a model called the weighted average cost of capital (WACC).
Risk Rate (Optional)
WACC = E/V(ke) + D/V(kd) (1 – t)
This looks complicated, but all we need to work out is the debt-to-equity ratio, the cost of debt (kd), the cost of equity (ke) and the tax rate (t).
Cost of equity requires a small calculation, where we say that it equals the risk-free rate plus beta, multiplied by the expected return of the market minus the risk-free rate. The return of the ASX 200 from 1990 to 2017 was about 9% per year, Yahoo Finance tells us that Wesfarmers has a beta of 1.1 (a beta of 1.0 means the shares have the same risk as the market) and we can assume the risk-free rate is around 2%.
Plugging these numbers in we get a cost of equity of 9.7%. The cost of debt can be found in the annual report (5.1%), as can the debt-to-equity ratio which was about 25% (this means Wesfarmers is 20% debt and 80% equity). Wesfarmers paid tax in 2019 of around 30%. This can all be found in the income and cash flow statements.
We now simply plug all these numbers into the WACC formula and get: 0.8(0.097) + 0.2(0.051) (1 – 0.3) = 8.47%. As I said above, using an 8% to 10% risk rate was a reasonable assumption and you can skip the calculation.
The Valuation
Now that we have the risk rate, growth rate and dividend, we use the formula mentioned earlier. It’s best to find a range of values to test the assumptions we’ve made.
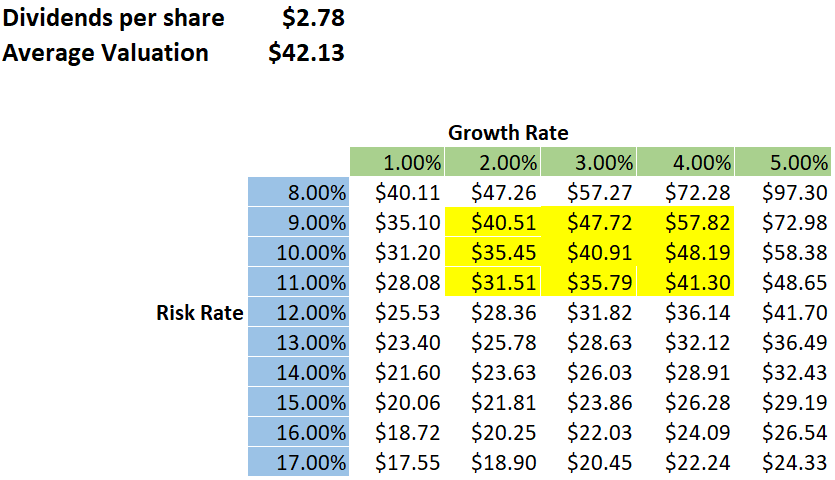
The figures highlighted in yellow are the ones I’ve used to calculate the average. As you can see, it gives us a valuation for Wesfarmers around 7.75% above the current share price.
Is Wesfarmers A Buy?
This model suggests Wesfarmers shares could be slightly undervalued, although we’ve made a lot of assumptions. For that reason, I would suggest that you look for a larger margin of safety (for example, a share that is undervalued by 20%) before investing.
Now that you know how to use the dividend discount model, you can try it yourself on the companies in the free report below.
[ls_content_block id=”14945″ para=”paragraphs”]
Disclosure: At the time of writing, Max does not own shares in any of the companies mentioned.


